
Tag Variation

When Hospital Rankings Punish Luck Instead of Performance

I'll be teaching my "Better Metrics" workshop (aka "Measures of Success," ala my book) twice in June:

Cambridge Investments - Open for Public Registration (Fairfield, Iowa) -- June 5
Lean Healthcare Transformation Summit (Chicago) -- June 13

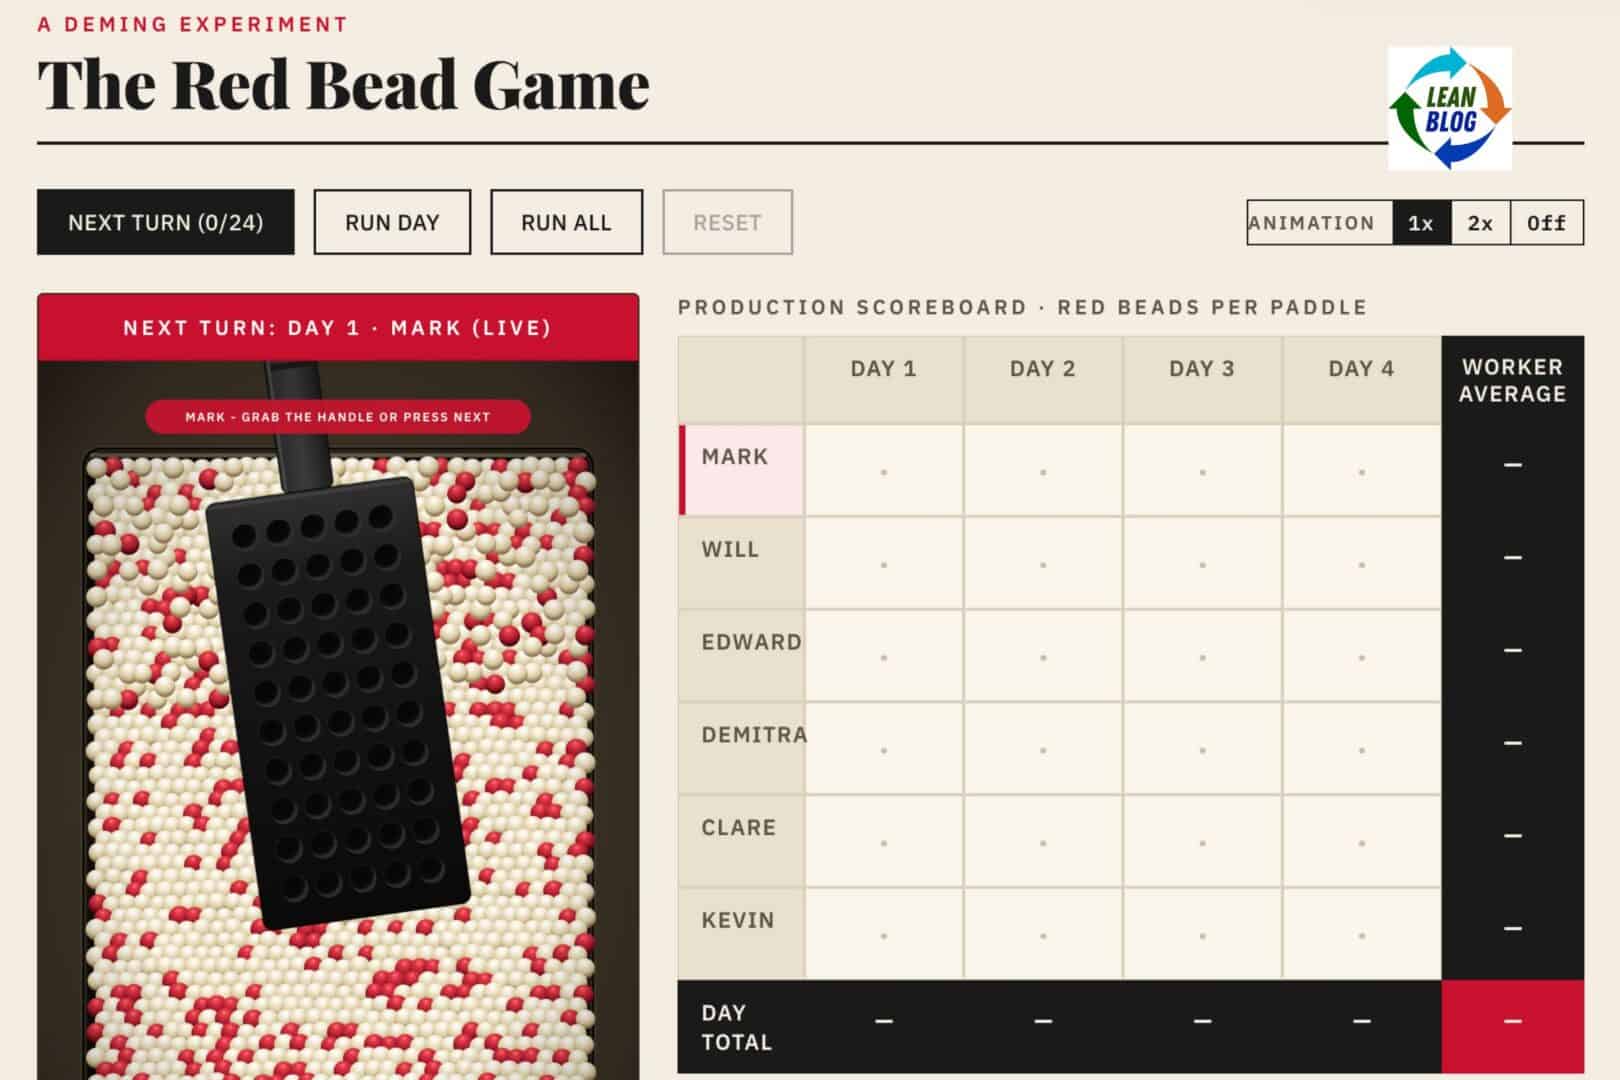
After facilitating the Red Bead Experiment in the workshop, one other way I've found to simulate variation is an online simulation that's available, of all places, on the BBC website:

"Can chance make you a killer?"

Ratings for “The Oscars” Were Lower in 2018? Should We Ask Why or Look for Longer-Term Trends?

Downward trending line graphic over gold trophy figures representing decline in success or performance.

As I blogged about yesterday, things went well at the Oscars... or, at least, no errors were made in the announcements. But that thing that didn't go well was the TV ratings.

Two Data Points Are Not a Trend
The headlines I saw had a lot of two-data-point comparisons. Headlines sometimes gave the percentage decrease in viewers or how many million fewer viewers there were. Many talked about "record low" but if you're tracking a metric "record low" or "all-time high" doesn't mean there's a "special cause." That "record low" could still be noise in the system.