Are Minor League Baseball Games Really Getting Slower? Signal vs Noise in the Data
Minor League Baseball has been experimenting with rule changes aimed at speeding up games, often as a proving ground for changes that may later reach Major League Baseball. Headlines and articles frequently cite small year-to-year changes in average game length as evidence that these interventions are working–or not.
But before drawing conclusions, a better question is: Are minor league games actually getting faster or slower in a statistically meaningful way–or are we just seeing normal variation in game length? This post uses Process Behavior Charts to examine long-term data across multiple leagues and separate real signals from noise.
This is the same mistake leaders make with workplace metrics–reacting to short-term fluctuations instead of understanding variation over time, a theme I explore in detail in Measures of Success: React Less, Lead Better, Improve More.
TL;DR: Small year-to-year changes in minor league game length can look meaningful, but when viewed over time using Process Behavior Charts, most variation turns out to be noise. Across several leagues, there is little evidence that pace-of-play rule changes have produced a sustained, statistically significant reduction in game length–at least not yet.
A recent article:
Minor League Baseball Expands Pace-of-Play Rules
The minor leagues are often used as a lower-risk model cell, or pilot area, for rules that eventually make their way to the majors.
Last season, MLB instituted an instant intentional walk, which sends a batter to first on a manager's signal instead of having to throw four pitches intentionally wide of the plate. This reduces some time but also eliminates some of the crazy things that happen occasionally, such as a batter swinging at one of those pitches and getting a hit:
I guess reducing the length of games is good, but reducing some of the variation in what happens on the field isn't necessarily good for the fan either, is it?
This season, MLB is reducing the number of trips to the mound or conferences that can take place on the mound each game, again in the attempt to speed up games by reducing delays.
The minor leagues have been experimenting with the use of a pitch clock that's meant to speed play by reducing the delay between pitches. I blogged last year about how this was confusing to me as a fan, since I didn't understand why and when the pitch clock was used or not used:
The pitch clock is being shortened from 20 seconds to 15, although the Florida State League (where I attended a game last year) was using the 15-second clock.
“…the pitch clock that began at Class AAA and Class AA in 2015 will be lowered from 20 seconds to 15 when there are no runners on base, the National Association of Professional Baseball Leagues said Wednesday. The timer will remain at 20 seconds with runners on.”
Why a Few Data Points Don't Tell Us Much
As I posted on LinkedIn the other day, the article included some length-of-game data from the Florida State League, but it was only three data points, which isn't very helpful.
“The Class A Florida State League experimented with a 15-second pitch clock in all situations the past two years, and its average time for a nine-inning game dropped from 2:41 in 2015 to 2:35 the following season before rising to 2:38 last year.”
With just three data points, we don't know how much the game length normally varies from year to year. The length of game average could just be fluctuating and could have nothing to do with the pitch clock.
Lesson learned: If presented with just two or three data points at work, ask people to #PlotTheDots so you can make better decisions and better evaluate changes you're making to the process.
If we plot just three dots, we get this chart:
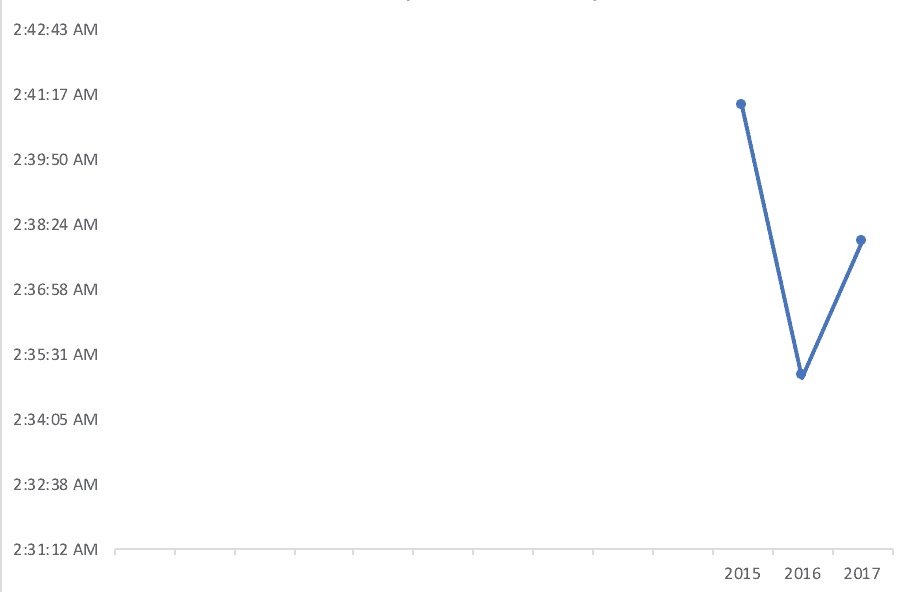
The length of game went down with the new rule. Then, it went back up a bit. Games were still shorter in 2017 compared to 2015. But, it begs the question of whether a few minutes here or there is a signal of a meaningful change or if it's noise in the data.
Plotting the Dots: Adding Historical Context
I emailed the Florida State League office and, like last year, they were very helpful with a quick response, sharing data for their league (and others) going back to 2005. See the spreadsheet they shared with me (Excel or Google Sheets). Note that the years go from right-to-left in the file.
The Florida State League games (2:38) were shorter than any other league. The AA Eastern League had an average 2:42 (using a 20-second clock). Leagues without a pitch clock had average times ranging from 2:45 (Rookie-level Gulf Coast League) to 3:05 (the AAA Mexican League).
What the Process Behavior Chart Shows for the Florida State League
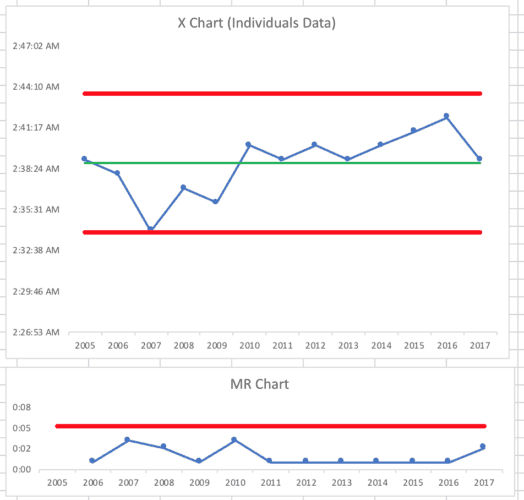
I used the data provided by the Florida State League to create a Process Behavior Chart that would better show trends over time. You can see my Excel spreadsheet and here is the chart, below.
Using all of the data points as the baseline for the average, as well as the upper and lower limits, I don't see any sign of a signal. It looks like a stable, predictable system over time.
There are no single data points above or below the calculated limits.
We have six consecutive data points above the average, but that's not a signal. A run of eight or more data points on the same side of the average would be a signal.
We also don't see 3 of 4 (or 4 out of 4) consecutive points closer to the same limit than the average.
All of these data points appear to be noise in the system. That means reacting to small year-to-year changes would risk attributing cause where none exists.

Did the Pitch Clock Prevent a Problem–or Create One?
However, the pitch clock intervention in 2016 may have prevented what would have been a signal.
If we look at a Process Behavior Chart for the years 2005 to 2015, it appears as follows. It's a stable and predictable system, and the limits tell us that the times from 2016 to 2017 would have been between 2:33 and 2:43 unless something changed in the system.

We know there was a system change… but the question is, “Did it make a significant impact on the pace of play and the length of games?”
Let's assume that, without the pitch clock, the average game times for 2016 and 2017 were 2:42 and 2:39 (those are made up numbers).
The Process Behavior Chart would then have looked like the chart below and we'd see eight consecutive points above the average. We'd ask, “What changed in 2010 that caused the average length of game to go up?”
Did the change to the 15-second pitch clock make a difference? It's possible, but the Process Behavior Chart with the actual game times doesn't really prove it to be so… at least yet.
Since the rules for evaluating a Process Behavior Chart require eight consecutive data points below the baseline average to prove a shift in performance, we wouldn't know for sure until after the 2023 season when we might see the eighth consecutive year with an average time under the chart's average of 2:38.
In a workplace, using a daily or weekly metric allows us to see eight data points much more quickly, which is one reason to prefer faster metrics instead of monthly metrics.
Either way, it's just a few minutes in the baseball games.. The times for the last two seasons could well possibly be well within the range of “noise in the system.”
Comparing Leagues With and Without a Pitch Clock
What if I chart one of the leagues that haven't used the pitch clock? What about the slower-paced Mexican League?
It looks like a stable and predictable system. The Process Behavior Chart methodology would say there's no evidence of change, even if a linear trend line would (perhaps incorrectly) imply games are getting faster.

Pioneer League
Looking at the Pioneer League, the chart tells us it's not a stable and predictable system.
We see eight data points below the average and 2017's time was above the upper natural process limit, which is indicative of a change in the system. It would be appropriate to ask, “Why were Pioneer League games slower in 2017?).

South Atlantic League
The South Atlantic League‘s chart shows something different — it looks like a stable and predictable system.

Different Leagues, Different Systems
Are minor league games taking longer? Well, yes and no, depending on the league.
Thanks again to the Florida State League office for so kindly (and quickly) responding to my inquiry.
The bigger lesson isn't really about baseball. It's about how easy it is to mistake short-term variation for meaningful change. Whether we're measuring game length, cycle time, patient wait times, or customer behavior, the same principle applies: without context, data can mislead.
Process Behavior Charts help leaders avoid overreacting to noise and instead focus on whether the system itself is changing. In this case, the data suggests that most minor league game-length fluctuations fall within the range of routine variation–making patience and continued observation more appropriate than quick conclusions.
This is exactly why I wrote Measures of Success. Whether the metric is game length, patient wait times, employee engagement, or financial performance, leaders need a way to distinguish real system changes from routine variation. Process Behavior Charts provide that discipline–helping organizations react less to noise, lead with greater confidence, and improve in ways that actually stick.