A Christmas Tale That Explains Process Behavior Charts
The Christmas Tale / Le Conte de Noël
Two years ago, I received an unexpected and incredibly specific Christmas gift from Charles Desneuf on LinkedIn. He wrote a PDF eBook about Process Behavior Charts… and Christmas!
This led to Charles collaborating with me on the English version of the eBook, which you can read or download in this post. I'm sure this appeals to the small subset of people who celebrate Christmas AND “Process Behavior Charts.”
For Christmas 2025: Enter to win a rare print edition of the book

How This Came to Be:
Charles tagged me in a LinkedIn post that was written in French. I don't read the language, but I could figure out what was happening in the book before going to Google Translate, thankfully.
His book is a Christmas tale that cleverly illustrates concepts related to “Process Behavior Charts.” Charles cited and mentioned my book Measures of Success: React Less, Lead Better, Improve More as a reference at the end of the book.
“Process Behavior Charts: Le Conte de Noël” — which translates to “The Christmas Tale.”

I reached out to Charles to see if we could work together to translate the book. He agreed!
This was the process (of course, we are going to talk about the process):
- He sent me the text from the eBook
- Charles gave me access to his Canva file, where he designed it
- I created a copy of the file (just to be safe, to be sure I wasn't changing his French book file)
- Copied and pasted the French text into Google Translate
- Tweaked the English output of Google for readability and such
- Checked with Charles on that language and a few other refinements.
After a number of iterations, we decided it was better to launch now and fix any problems rather than wait for perfection (and Christmas is approaching!!). We wouldn't want to publish the perfect eBook on December 28th!
English Version:
You can download the PDF or use the flip book reader below:
Merry Christmas! Let us know what you think about the Christmas tale by leaving a comment on the post, or by sharing on Linkedin.
French Version:
A version that's updated from what was originally on LinkedIn — Download PDF
Joyeux Noël!
You can learn more about Charles via his website. He helps “organizations deliver better software that their customers enjoy, faster & more safely.”
Learn More About Process Behavior Charts:
You can learn more via my blog posts or my book on the topic. Scroll down to see more posts.
Primary sources for these concepts include the books by the statistician Donald J. Wheeler.

I recently recorded an upcoming episode of the Lean Blog Interviews podcast with Dr. Peter Pronovost, the Chief Quality…

A pitch from a personal injury law firm showed up in my inbox. The subject line was about older workers dying on the…

The target printed on the chart was zero percent. The red line had never been near zero. Not in the nine months posted…

TL;DR: The NHS backlog gets narrated one month at a time, and millions in bonus money ride on the moves. A Process…

MLB's first month with robot umpires gave us a 7.3% jump in walks, a five-minute increase in average game time, and a…

Most hospital quality dashboards are designed to answer one question: Are we OK? Green means yes. Red means no. The…
FREE GUIDE FOR LEADERS
What Your Scorecard Isn't Telling You
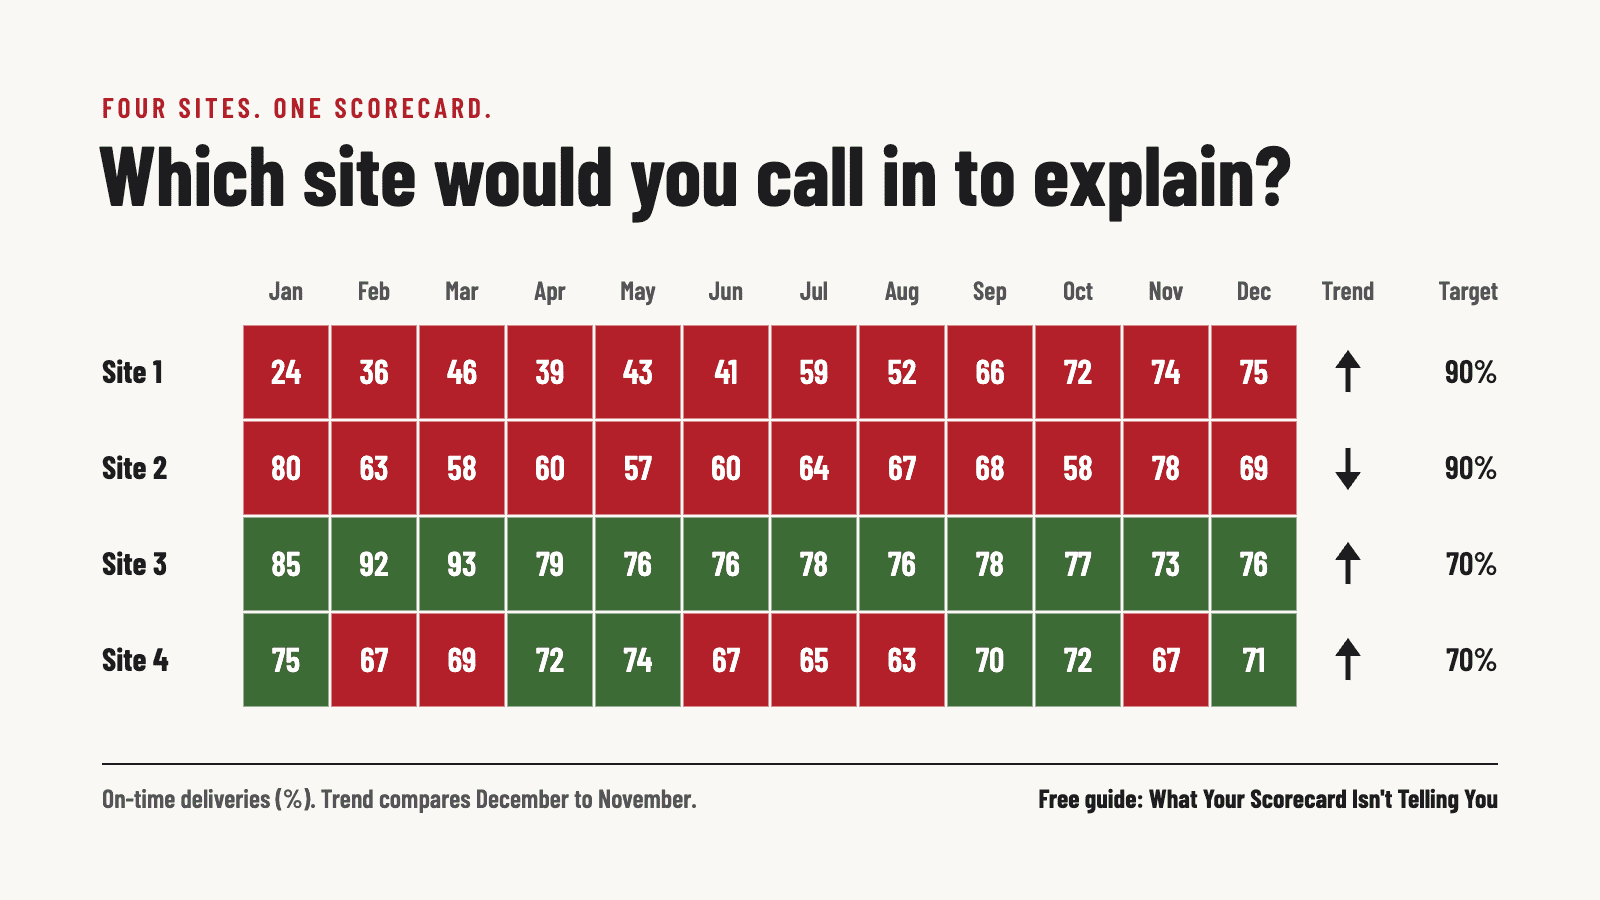
The free guide shows four sites and one red-and-green scorecard, and asks which site you would call in to explain. Most leaders pick the wrong one. It's written for the executives who own the scorecard, so it's an easy one to forward.
18 pages. No statistics background required. The download link appears as soon as you enter your email.
Stop reacting to every up and down in your metrics
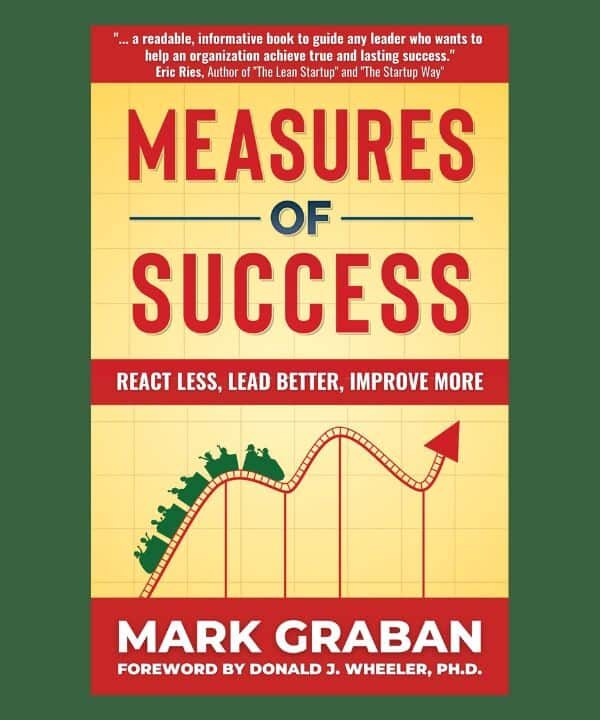
In Measures of Success: React Less, Lead Better, Improve More, I show how Process Behavior Charts help leaders tell signals from routine variation, so they spend less time explaining noise and more time improving the work. The foreword is by Donald J. Wheeler.
Read a free chapterSee buying optionsFree guide: better scorecards