Why Red-Green Charts Mislead Leaders: Understanding Variation the Deming and Wheeler Way
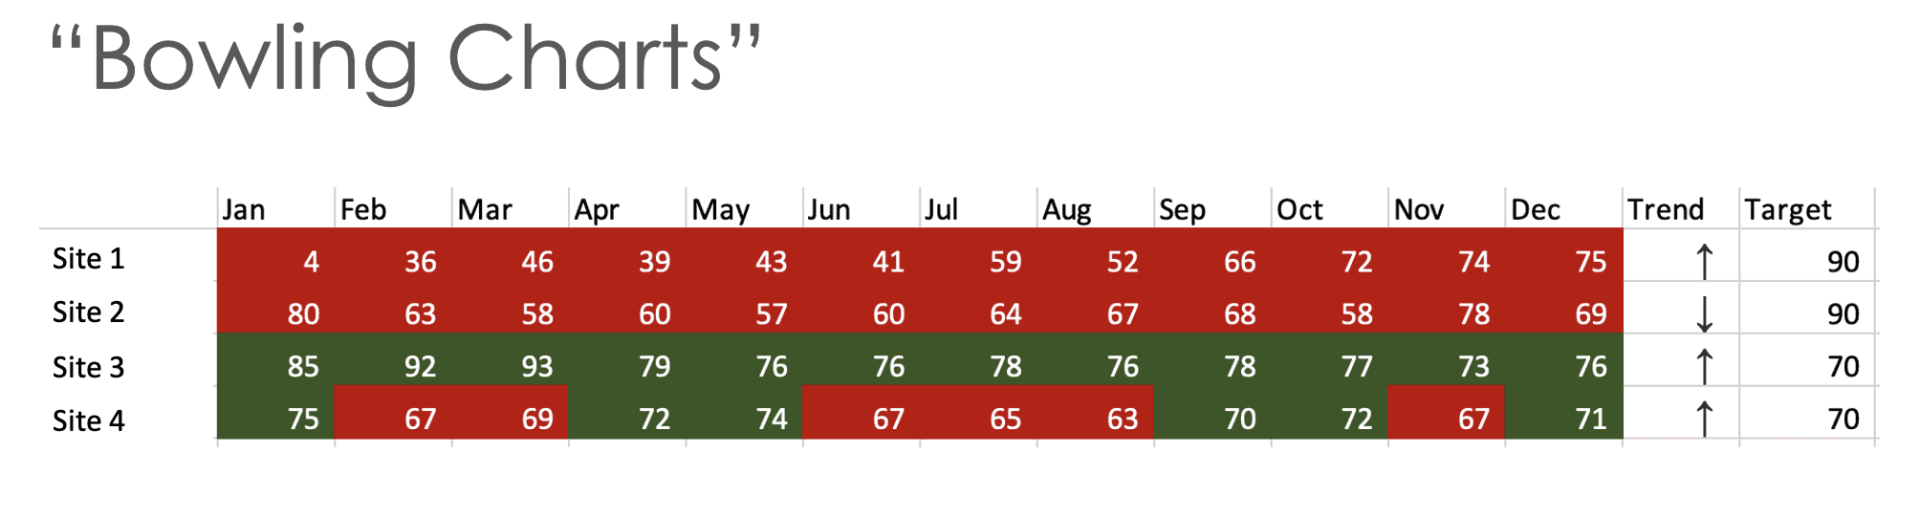
tl;dr: Red-green charts push leaders to react to every up and down, turning normal variation into false drama. Process behavior charts provide the context needed to see signal vs. noise–so leaders improve the system instead of chasing each data point.…