A Webinar About “Measures of Success”: Case Studies on Signal vs. Noise
TL;DR: This recorded webinar shows how Process Behavior Charts help leaders distinguish real signals from routine noise in performance metrics–so they stop overreacting to every up-and-down and focus instead on improving the system in meaningful, sustainable ways.
As I blogged about in this series of posts, I presented a webinar yesterday that was hosted by KaiNexus.
You can register to view the slides and recordings, but I'll also embed the YouTube videos below.
As I mentioned in the webinar, text descriptions of performance measures might be interesting, but they don't provide much context or insight.
- 352 registrations
- That's the second most this year
- Registrations today are above average
- Registrations are up 26.6% from last month
All of those bullet points would make me say, “So what?” Was the number of registrations yesterday something that represented “noise” (or typical performance) or was it a “signal” that something was different?
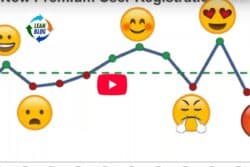
We have, of course, a Process Behavior Chart that I maintain for the number of registrations:

Historically, the number of registrations fluctuates within a fairly predictable range. Some webinars are above average and some are below average. The one exception was a webinar that Jess Orr presented on the application of A3 thinking to everyday life.
Her webinar had over 700 registrations, exceeding the calculated Upper Natural Process Limit. That's a “signal,” and it was worth asking, “What changed?” or “What was different?” We didn't really have a good answer. When Jess did a follow-up “deep dive” webinar, we both promoted it the same way… and fewer people registered. We had a strong, but unsustained, change in our system.
By the way, Jess is doing a new webinar for us in January (“Applying Strategy Deployment to Your Personal Goals”) and you can register now.
Back to our webinar Process Behavior Chart… my webinar yesterday had a registration number that is well within the range of “noise.” It's not a good use of time to ask why registrations went up (or why they were lower the previous month).
The number goes up, the number goes down. Sometimes, it goes up twice or three times in a row… or you get two or three that are above or below average. It's not worth explaining or reacting to. But, we can still work to improve our webinar system — coming up with topics that have broader interest, promoting the webinars differently, etc.
We can improve a “predictable system” — we just need to do so in systematic ways (we can do an A3 for structured problem solving, as Jess presented).
Anyway, here is the recording of the webinar, followed by two “bonus” videos with content that I couldn't fit into the 45-minute webinar. For the slides, click here. I had a little fun with a really bad, made-up game show called “Is It A Signal?” Play along…
Thanks for checking it out.
Webinar Summary: Using Process Behavior Charts to Tell Signal from Noise
In this KaiNexus-hosted webinar, I walked through how Process Behavior Charts (PBCs) help leaders and organizations make better decisions by distinguishing signal (meaningful change) from noise (routine variation). The core problem we explored is familiar to many leaders: metrics go up, metrics go down, and far too much time gets wasted explaining changes that don't actually mean anything.
The webinar began with a practical refresher on what a Process Behavior Chart is–and what it is not. A PBC is more than a run chart. By plotting data over time, calculating an average, and establishing statistically derived upper and lower natural process limits, the chart gives leaders context. That context allows us to answer a critical question: Did the system really change, or are we just seeing normal fluctuation?
From there, the session focused on how to identify signals, using three primary rules:
- A data point outside the natural process limits
- Eight consecutive points above or below the average
- Three consecutive (or 3 out of 4) data points closer to one limit than the aveage
Importantly, the chart can tell us that something changed–but not why. Understanding cause-and-effect still requires judgment, curiosity, and going to the work.
To make the concepts tangible, the webinar used a wide range of case studies, including:
- Webinar registration data (including Connexxus' own history)
- Book sales data (yes, including my own)
- Voter turnout in U.S. elections
- Emergency department wait times
- Traffic fatalities and pedestrian safety data
- Hospital performance metrics
- Manufacturing and business headlines pulled from the media
Across all of these examples, the same pattern emerged: headlines and two-point comparisons often describe “record highs,” “sharp drops,” or “significant increases,” when statistically speaking, nothing meaningful has changed. In contrast, Process Behavior Charts helped reveal when changes truly were signals–and therefore worth investigating, learning from, or trying to sustain.
The webinar also addressed common challenges, including:
- How to work with limited data (starting with fewer than 15-20 points)
- Why recalculating limits too often undermines learning
- How to evaluate improvement efforts without overreacting
- Why rare-event data (“chunky data”) may require alternative approaches, such as plotting days between events
- How PBCs support better evaluation of PDSA cycles by using more frequent data responsibly
A recurring theme throughout the session was leadership behavior. Overreacting to noise consumes time, distracts teams, and creates frustration. When leaders stop asking “Why did the number change?” and start asking “Is this a signal?”, they create space for better problem solving, better use of A3 thinking, and more effective improvement work.
As we wrapped up, the key takeaway was simple but powerful:
When leaders react less to noise, they lead better–and that's how real improvement happens.
The goal of Process Behavior Charts isn't statistical perfection. The goal is better decisions, better systems, and better outcomes.
Want to go deeper?
If this webinar resonated, my book Measures of Success: React Less, Lead Better, Improve More walks step-by-step through how to use Process Behavior Charts to interpret metrics correctly, avoid overreacting to noise, and focus improvement efforts where they actually matter. It's written for leaders who want fewer knee-jerk reactions, better questions, and more meaningful results from their data.
If you're serious about improving performance–not just explaining it–the book provides the practical framework to do exactly that.