


Training Within Industry (TWI) and Toyota Kata are often discussed as tools or programs, but their real power lies in the skills they develop–especially coaching skills. This recorded webinar explores how TWI and Kata patterns help leaders practice daily coaching, reinforce learning, and build a sustainable culture of continuous improvement rather than relying on one-time events or heroics.
Here is a recorded webinar…
I played host (along with KaiNexus) for this webinar that was held Tuesday, August 14 at 1 pm ET.
How TWI and Kata Develop Coaching Skills
“Oscar Roche and Jim Huntzinger of Lean Frontiers will discuss how learning and developing the skills provided by the practices of Training within Industry (TWI) and Kata behaviors will develop good coaching practices while simultaneously developing the culture and actual practice of process improvement in your organization.”
Why Coaching Patterns Matter More Than Tools
You can listen to a podcast preview I recorded with Oscar (and read a transcript on the KaiNexus blog).
Click here to register to view it or get the slides (PDF) or view the recording below via YouTube:
Using Process Behavior Charts to Learn From Webinar Data
Oh, and since I manage the KaiNexus webinars, one metric we track is the number of people who register for each monthly webinar.
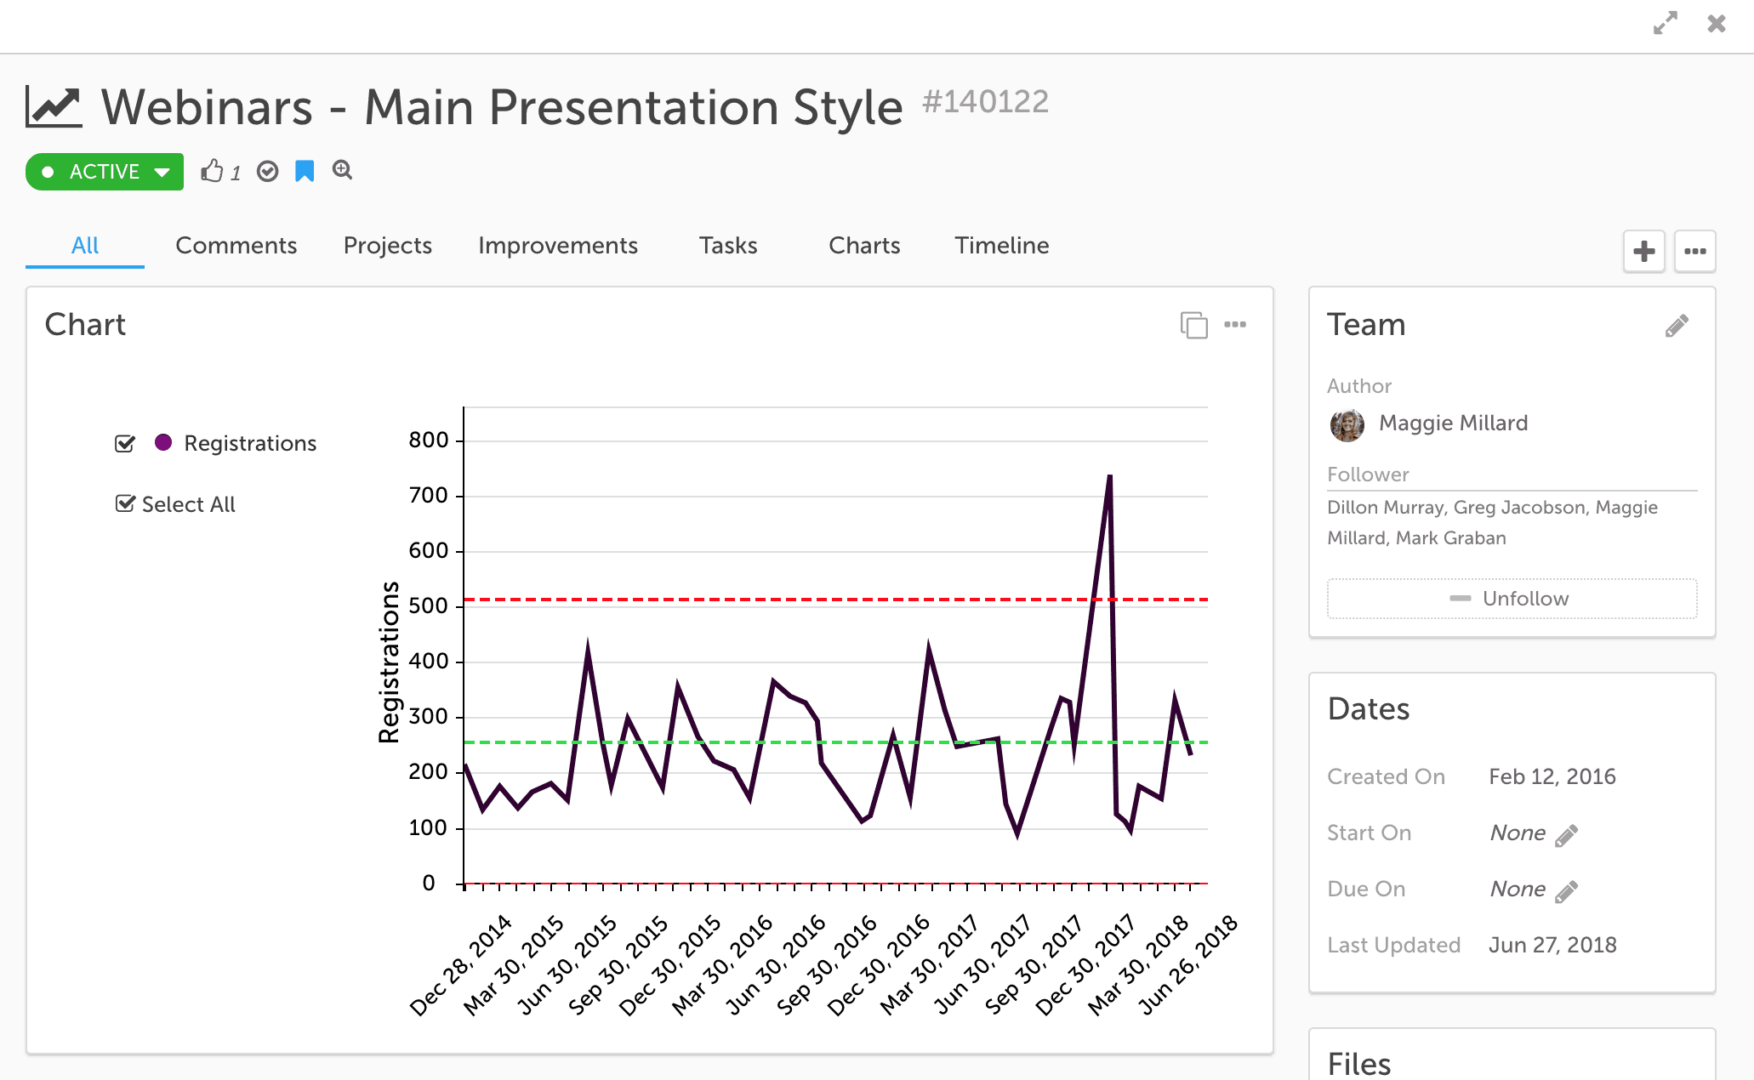
We use our own KaiNexus software for managing and improving KaiNexus the company, and we have functionality for “control charts” (aka Process Behavior Charts) in our platform:
What the Webinar Data Tells Us–and What It Doesn't
The dark line is the data — the number of people who register.
The green line is the average, which was established off of a baseline time period.
The red lines are the calculated lower and upper Natural Process Limits.
The “signal” (the one point above the red upper limit) was the first webinar that Jess Orr gave on A3 thinking in everyday life.
Before that “signal” (and afterward, it seems), we had a “predictable system” with predictable outputs. I could predict that any webinar would attract between zero and 500 registrations, roughly. We basically do the same things to promote each webinar — my social media, our email lists, etc. Some sources of “routine variation” (or “common cause variation”) in the metric might include the presenter's level of fame, their social media or email list reach, etc.
It makes sense that the number would fluctuate. The Process Behavior Chart tells us the “voice of the process,” so we see how much variation there is.
We can do things to increase webinar attendance — and I'd look at boosting the average number of registrations. A “signal” that I've increased the average would be eight consecutive points above the old average. We haven't had that.
A signal for the Jess Orr webinar suggests that something was different in the system since it gave results outside the predictable range. Jess gave an excellent webinar. It was a relatable topic and a bit unusual, so that might have attracted a lot of people. She did a lot of promotion on LinkedIn… but so do our other webinar presenters.
Avoiding Overreaction: A Coaching Lesson in Metrics
The Process Behavior Chart tells you that something changed. It just won't tell you what changed. And whatever magic we had for the Jess webinar wasn't repeated even when she did a second follow up webinar (registration numbers were lower and I think she did the same things as the first time). The second webinar was about a “deep dive.” Maybe people don't want deep dives?
The Process Behavior Chart helps me avoid overreacting to every below-average point or every blip in the numbers. I don't waste time looking for or cooking up an explanation for the noise. That way, I can focus on doing what I can to improve the system and its average performance… and apparently, I'm not doing that very well :-(
Coaching, Learning, and Building Capability Over Time
TWI and Kata work because they focus on building skills through repeated practice, not because they offer a new framework or set of tools. Coaching, in this context, is not about telling people what to do–it's about helping them think, reflect, and learn from the work. That same mindset applies to how leaders use metrics. When we react to every data point, we model anxiety and short-term thinking. When we use Process Behavior Charts, we model patience, curiosity, and respect for how systems actually behave.
Seen together, TWI, Kata, and Process Behavior Charts reinforce the same lesson: sustainable improvement comes from developing people's capability over time. Leaders don't create better results by pushing harder or reacting faster. They do it by practicing better coaching behaviors–day after day–until learning becomes the norm rather than the exception.
But the webinars are great! Check them out in our KaiNexus webinar library.


