


Here's a reprieve from posts about my new book Measures of Success: React Less, Lead Better, Improve More. Although I will mention that the book should be available very soon in the Apple iBooks store. And today's post is on themes from the book. And I'll talk a bit about process (if that seems Lean enough for you).
Unfortunately, I've had two trips to the emergency room within the past year, due to stomach flu problems. Or, it was possible food poisoning. In cases like these, the doctors aren't really worried about the exact root cause, because the treatment is the same either way. They're treating symptoms.
Last Wednesday morning, I woke up early, and I was sick. Stomach issues. Fever. I noticed on my Fitbit that my heart rate was elevated above normal levels. I was working from home that day, so I stayed in bed, slept, and rested. I wasn't really able to eat anything, and it was hard to get liquids down.
About 6 pm, I noticed that my fever had come back, along with the high heart rate (my resting heart rate is normally between 65 and 70, so 120 or so seemed like a sustained “signal” that something was wrong with my body's system). The high heart rate wasn't part of “noise” or “routine variation.” The sickness seemed to be a “special cause.”
So, I knew something had changed — and data confirmed it (which was more of a curiosity than anything). Sometimes, we discover a metric has changed, and then we go to investigate to see what happened.
Here is my Fitbit chart that goes up until about 6 PM that evening:
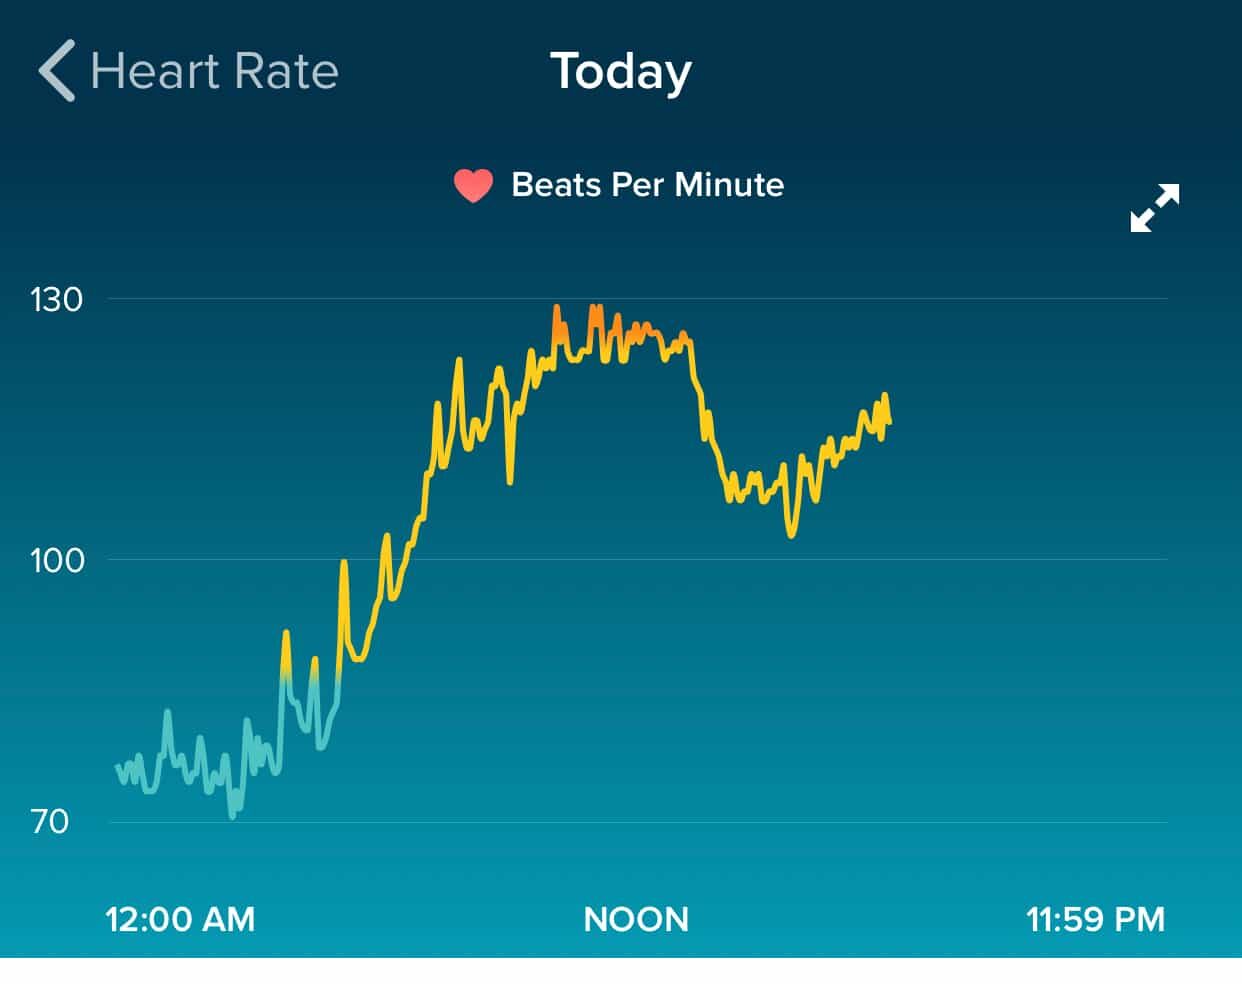
Fitibit doesn't allow you to easily dump the data (it's stored in 5-minute increments, it seems) so I won't draw a formal Process Behavior Chart. It's not really needed to see the shifts in my heart rate.
I've annotated the chart and you can see I didn't need calculated “Natural Process Limits” or a rule looking for eight consecutive data points above the average heart rate that was there before the illness kicked in.

The hours right after midnight, above, appear to be a pretty stable period, albeit higher than my heart rate is on a typical night.
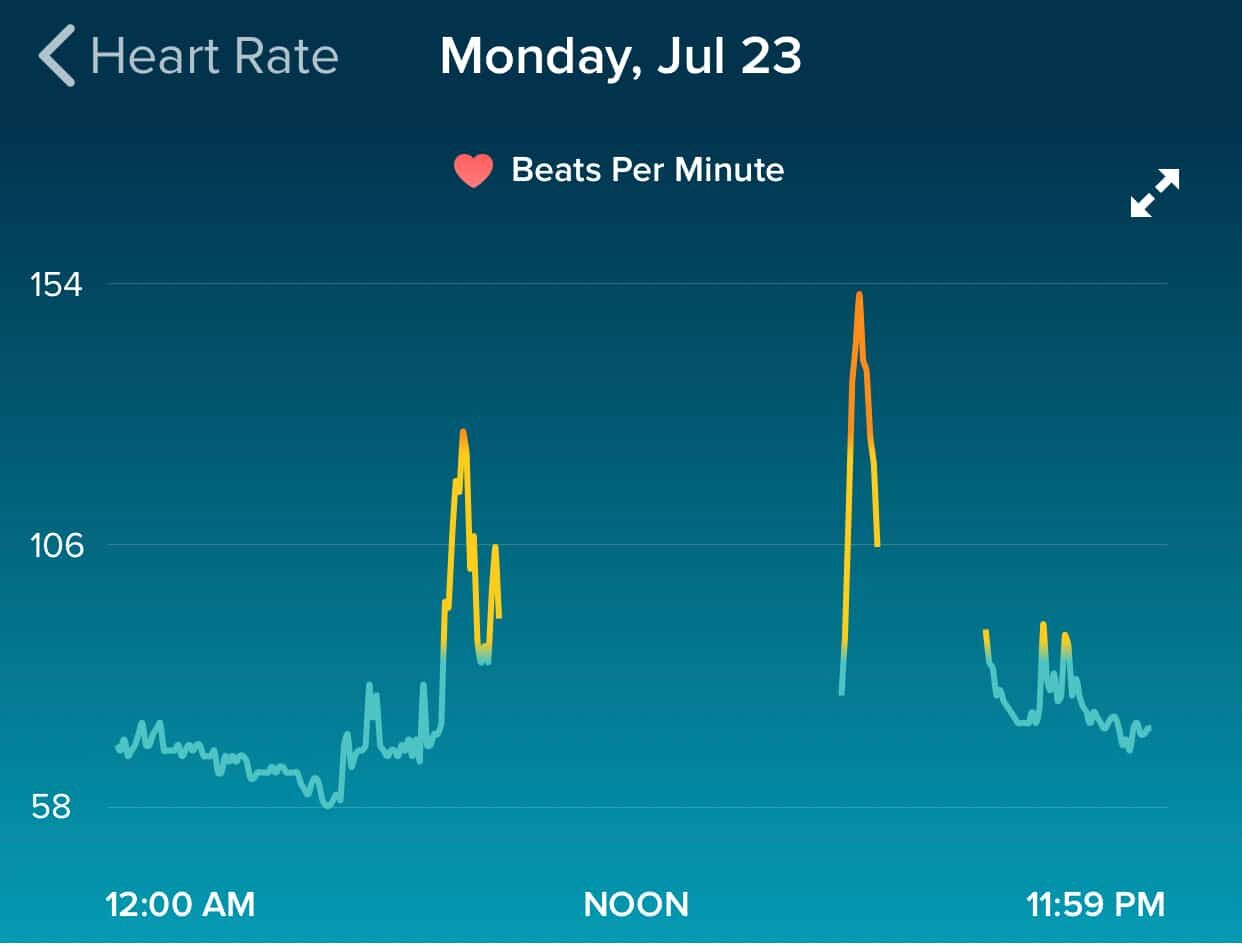
For comparison, below is a chart showing a night before I was sick. You can see my sleeping heart rate is lower and the spikes during the day are 1) me going for a walk in the morning and 2) hitting the gym in the afternoon (I often don't wear the Fitbit all day long).
Back to last week when I got sick, when my fever and heart rate was so high, a friend who had been sick recently strongly urged me to see a doctor. I called our insurance telehealth service. The doctor said it sounded like I was dehydrated, given the heart rate, so I should go get an IV.
He said, “You can go to Urgent Care or the Emergency Room.”
CareNow or CareSoon?
Knowing that Urgent Care would be cheaper (and hopefully faster), I drove myself to the nearest Urgent Care. The place is called “CareNow.” They said it would be a 90- to 120-minute wait. So much for the “Now” part. I called another location about 10 minutes away, and they said they had no wait.
I hoped they were being honest. It made me wonder why CareNow #1 wasn't suggesting that patients (those who could) go to CareNow #2. I'm guessing they each have their own goals and metrics that get in the way of teamwork or optimizing the company as a whole.
I got to CareNow #2, explained why I was there and started filling out paperwork. The clerk was about to collect my co-pay, but the phone ran,g and I overheard her say:
“No, we can't do IVs here.”
Better to learn that BEFORE the co-pay and additional waiting.
A Patient in the E.D.
So, I drove to the local hospital, part of a major system that's pretty dominant in this area.
It was about 7:30 PM, and I was stunned that the E.D. waiting room was empty. Nobody. No patients. No family. Well, good.
They got me back to a room right away. Everything was pretty efficient. The biggest wait was going to be on some labs.
They connected an IV port to my arm and injected some nausea medication. There was a bit of a miscommunication where I thought they hadn't started the IV because they were waiting on labs.
So, I watched TV. The registration person came in and got my info and my credit card. I do appreciate how care is prioritized over collecting payment first thing.
The doctor came in and said, “The labs are clear, you can go home…” and she started to go into my discharge instructions.
“Wait, what about the IV?”, I asked.
“Oh, that's empty, we already gave it to you.”
The bag was behind me. I was a little out of it. I guess what was obvious to them wasn't obvious to me as a patient.
When I was in a different E.D. last year for a worse bout of stomach flu or whatever (I had a 104 F fever and had “fever convulsions”), there were similar miscommunications about whether they had started my IV pain reliever or not.
LESSON LEARNED: Don't assume the patient knows what's going on. Overcommunicate. As a patient, ask questions… the answer you get might surprise you.
During that first E.D. visit, one thing that stood out to me was “great people, bad system.”
EVERY single time that somebody came into my E.D. bay for some reason, they'd end up leaving to go get something else that they forgot or wasn't stored at the point of use. There was a huge opportunity for improvement there.
Cause and Effect of the I.V.
But, back to this most recent stay. This chart shows the clear effect the IV had on my hydration, as illustrated by the heart rate dropping:

Looking at metrics and variation this way isn't mainly about the tools, like Process Behavior Charts or other Statistical Process Control charts. What's important is the way of thinking.
Looking at my heart rate over time, I shouldn't react to every up and down in the data. “Why was my heart rate higher yesterday?” isn't a question I should be asking if the rate is within the range of routine variation for me.
Here is my resting heart rate since the beginning of July (the daily number for each day):

I see a period in the first part of July (outlined in yellow) where my resting heart rate seems to fluctuate around an average of 72.5 or so. Then, there's a drop where it seems to be fluctuating around a lower average of 68 or so. When I got sick on August 1 (and continued to have a fever off and on for three days), you see the spike (a “special cause” or a “signal”) and now what looks like a recovery to where it had been.
So why the difference between the first half and second half of July? Could my heart health have improved that quickly? Nah… it could be measurement error or quirks of the Fitbit?
Here is how Fitbit defines “resting heart rate“:
“…calculates your resting heart rate by measuring your heart rate when it detects sleep, and by measuring it throughout the day while you are awake but inactive (no steps detected). If you don't wear your trackers to bed, it will only be able to measure awake but inactive periods during the day. In that case you may find that your RHR is reported a little higher than it would be otherwise. I also recommend for the most accurate RHR to wear the trackers while you sleep.”
I almost always wear it while I sleep. But sometimes I wear it all day and sometimes I don't. Could that affect the resting heart rate?
Yeah, these are the types of things I think about while I'm sick… I hope, however, that it illustrates some of the differences between “signal” and “noise” in a metric — and the connection between causes and effects. There is no “root cause” for noise, but there is usually a root cause to be found for a signal when we look at metrics or a system.


The variation in process is often profound to understand, yet difficult to believe that Lean principles couldn’t help improve.
This reminds me of the blood draw for my annual physical last Friday, which led to a call on Monday, that the samples were somehow not good due to transportation and the ice pack getting too close to my samples.
The lab tech/nurse was kind enough to invite me back in for a do over of 4 tubes being drawn.
My curious response was to walk through a 5-Why to identify the root cause of the process break down but no one really had interest in that approach.
The nurse on Tuesday morning told me that she usually draws the blood and apologized for the inconvenience. The 1st nurse said this had never happened to her before and I’ve never had it happen to me. Seems random but an opportunity to review standard work and where the process broke down.
No different than our organization or others I work with, who are too busy or feel they might be to blame. No blame here, just process improvement opportunity. The private Medical Sector doesn’t seem to be too engaged with Lean principles as much as Hospital systems. Unfortunately I have no data on the # of times this takes place. Maybe I was just special.
I bet if it’s happened to you, it happens to others. I could see that process problem happening again.
Maybe they brush it off as not being important – it was an inconvenience (and increased costs) instead of being life threatening. Still, if they had a culture of continuous improvement, I bet it would be easy for somebody to react and come up with a clever change to error proof against a tube getting too close to the ice pack.
I’ve sadly seen hospital leaders brush off problems that DID cause harm to patients. They feel sad for a minute and then move on.
Where is the fire and passion for the patients?? How does that get extinguished in people after a few decades in healthcare??
I recently talked to a manufacturing person who was interviewing for a job in healthcare. He wanted to talk about improving quality and safety. The healthcare leaders interviewing only wanted to talk about cost reduction. He pulled out of the process. I can’t blame him for that. Healthcare loves to say, “We’re not just making widgets… this is life or death.” OK, then you need to act like it.
Some of the original discussion about this last week on LinkedIn: