

How Fear-Based Leadership at GM Led to Faked Production Numbers
GM Got Gamed (Or, How to Fudge Your Production Numbers to Keep the Boss Happy)
TL;DR: At a GM engine plant, fear-based leadership pushed supervisors to falsify production data to avoid punishment. The numbers looked good, but real problems stayed hidden–proving that fear doesn't drive performance, it drives lies.
Fear-Based Leadership at the GM Livonia Engine Plant
Following up on my post about my recent experience with metrics and processes being distorted (and my less-than-perfect Lean coaching efforts), I was thinking back to some first-hand experience I had when I started my career at the GM Livonia Engine Plant circa 1995. It's the most blatant example of someone intentionally distorting data that I've ever seen… but it's totally understandable. I blame the senior leaders, not the front-line supervisor, in this case.
Unrealistic Production Targets and Impossible Expectations
Our engine block line was designed at a throughput goal of 92 blocks per hour. We could machine 92 blocks in an hour if everything ran perfectly, but it was rare and extremely unlikely to ever happen… running at that 100% pace for an entire hour.
Our plant superintendent, Bob (he was the #2 guy in the plant), decided that 60 pieces per hour was an acceptable number (partly based on productivity benchmark numbers that were attributed to Toyota). If you produced anything below 60 blocks in an hour, you'd have to explain why.
Managing by Fear, Yelling, and Intimidation
Now, Bob wasn't really the listening, problem-solving type. He managed by fear, yelling, and intimidation. There was more yelling than there was coaching. So the flipcharts hung in a row on the wall, and Bob worked down the line.
The Meeting Was Supposed to Solve Problems
Before I get to the numbers, it's worth explaining the meeting where they got reported. Every afternoon, supervisors and support staff from across the plant gathered for a standup. Final assembly was there, along with the machining departments that made the components — blocks, rods, crankshafts, and heads. Maintenance leaders, other support staff, and engineers like me were in the room too.
Each department brought a flipchart showing, hour by hour, the production goal against the actual count. There was a space on the chart to explain any gap: machine downtime, a tooling problem, whatever had happened that shift.
The meeting was a Lean practice, though we weren't allowed to call it that. It had been brought to the plant by the internal consultants GM Powertrain headquarters had hired, people who came from companies like Nissan and from Toyota suppliers, with real experience. Plant management didn't want the help and didn't want to learn about “Toyota stuff,” so the consultants operated under a quiet mandate to introduce some Lean methods without saying the words “Lean” or “Toyota” out loud. Office politics.
The daily review was meant to break down silos. Look across the plant for the bottlenecks that would affect assembly, prioritize maintenance and other resources, and use the “reasons why” on each chart to prompt discussion and problem-solving. That was the design.
Hear Mark read this post — subscribe to Lean Blog Audio
How Hourly Production Data Was Recorded on the Line
Anyway, at the end of the engine block line was a mechanical counter that recorded the hourly production counts. The UAW workers who unloaded blocks dutifully recorded the number every hour on a piece of paper.
The numbers might have typically look like this as they were written down:

That's an average of 48.6 pieces per hour. Not quite up to Bob's standards, although here we exceeded the goal in three hours and came somewhat close to 92 in one hour.
From Honest Data to Fudged Numbers Before the 4:00 Meeting
At the end of each day, before our “4 o'clock meeting” where the plant salaried staff took its daily verbal beating from Bob, Scott, the production supervisor (the technical title of “Team Coordinator” didn't quite fit) would pick up the counts and do a little daily editing.
Scott would take the numbers and turn them into something that looked like this, I kid thee not:
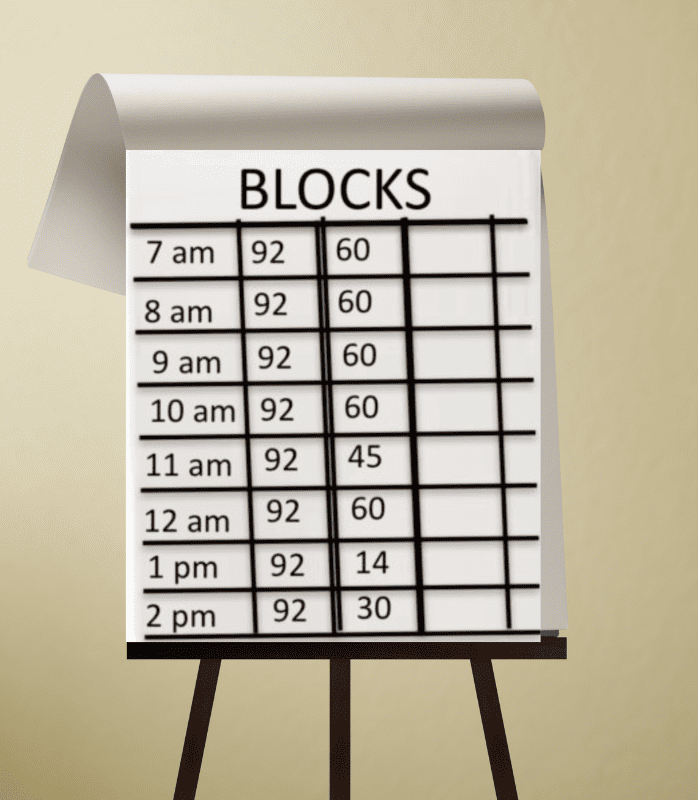
That's still an average of 48.6 per hour. But it's much more consistent. Too much so. Unnaturally so. Unbelievably so.
Why Leaders Accepted Comfortable Lies Over Real Learning
Bad ole' Bob never questioned these numbers. I know it's hard to believe that he would believe those numbers, but when reviewing multiple departments at that daily verbal abuse meeting, Scott's fudgery helped avoid too much attention that a really bad hour would have brought upon him. Rather than asking, “Why don't we have more hours with 86 blocks?” the upper limit of expectations was set too low, at 60.
I asked Scott once why he fudged the numbers each day, and his answer was simple (imagine the clipped Michigan accent of a chain smoker):
“Bob wants 60 an hour, he gets 60 an hour.”
Other departments got more than their share of the daily beatings. His diagnosis never changed: we weren't trying hard enough. His countermeasures were always the same two, more urgency and more intensity. A coworker and I had a running bet on which word he'd use first.. Bob always had the same pronouncement for our problems: we weren't trying hard enough. And apparently, more yelling from Bob was what we needed to motivate us. But that never worked.
He sort of looked like this when yelling at us.

Urgency and Intensity Are Not a Substitute for Leadership
For Bob, “not trying hard enough” came in two flavors: we lacked urgency, or we lacked intensity, or both. Like a shorter Mike Ditka, with a signature bad toupee instead of a signature mustache, Bob would yell and scream, and spit would fly. On the worst days we'd get “we need urgent intensity” or “we need intense urgency.” The yelling, the fear, and the fudged numbers all got in the way of any real problem-solving.
What Changed When NUMMI-Trained Leadership Arrived
Obviously, situations like this are part of the reason our plant manager eventually got moved out of the way (promoted and put out to pasture at headquarters) for a new, NUMMI-trained plant manager. That started our road to recovery as a plant. It was never a worker problem; it was a management problem. That's an important lesson of Lean — what's required is a change in management practices and management philosophy.
I'll leave it for another post to talk about that “4 o'clock meeting” and what its goals were supposed to be. The meeting was designed by some internal Lean consultants we had, but was co-opted by non-Lean management mindsets. Why weren't the lean consultants being listened to? Again, I'll save that for another post.
Why Gaming the Numbers Is Always a Management System Failure
Fudged numbers weren't a people problem–they were a system problem. When leaders set impossible targets, punish natural variation, and rely on fear instead of curiosity, they guarantee distorted data and stalled improvement. Honest metrics only happen when the environment makes honesty safe, and when leaders treat bad results as signals to learn–not reasons to blame.
Related Lessons on Metrics, Blame, and Psychological Safety
The behavior I described at GM wasn't unique to manufacturing–and it wasn't a one-off. Whenever leaders apply pressure without curiosity, metrics stop being signals for learning and start becoming targets to survive. That's when people game the system.
I've seen the same dynamics play out in healthcare, education, and financial services, where fear, unrealistic goals, and blame-based accountability distort reality instead of improving it. Whether it's production counts, test scores, or sales targets, the pattern is remarkably consistent: people don't fake numbers because they're dishonest–they do it because the system makes honesty unsafe.
If this story resonates, you might find these related posts helpful:

If your emergency department metric improved this quarter and you felt good about it, the problem might not be your emergency department. It might be…

TL;DR: A USPS clerk tapping the green smiley face on a customer feedback screen is a small but telling example of gaming the system. When performance…

TL;DR: Dolphins gaming rewards illustrate a core Lean lesson: behavior follows system design. In organizations, quotas and incentives combined with…

tl;dr: Wells Fargo didn't have a “bad apples” problem–it had a bad management system. Unrealistic sales quotas and fear-driven…

Recent lessons from NICU innovation, primary care access, fan safety in baseball, and ongoing VA wait-time gaming This post is a collection of recent…
tl;dr: In many organizations, “accountability” is code for blame and punishment. Lean leadership redefines accountability as improving…
Load More


[…] production superintendent was fooled by perpetually faked data. I wrote about it 2007 in “GM Got Gamed.” The superintendent never went to the gemba in a meaningful way, he never saw the […]
Some managers do not get the concept of variability in a process. This example is similar to one I experienced in a hospital. During a meeting of the board, a consulting heart surgeon was presenting data on AMI occurrence. The data showed a normal variation over several months, with an aggregate trend downward. Several members of the board, including the CEO, COO, and the hospital’s process expert voiced concerns that one month’s values were above the average then went down in the following month. This pattern repeated itself, and the individuals wanted to know why all the months did not show a value below the average. The surgeon was well versed in the principles of statistical process control, and he attempted to explain as did I. Alas, to no avail..
Carl – thanks for sharing that story. It certainly illustrates the need for leaders to understand variation. That’s why I always recommend Dr. Don Wheeler’s book “Understanding Variation.”
There’s so much time wasted trying to explain every up and down in a chart when it’s common cause variation or noise in the system. This really interferes with real improvement…
as a manufacturing engineer who started out on a GM engine plant I know the situation. unfortunately it is common in most businesses. I found that an MBA grad seems to have the worst grasp of reality in production.
I agree with you on all counts, Denis. This is a problem today, in the year 2015, in healthcare. People get pressured into making the numbers look good. This happens all throughout healthcare, but I think last year’s VA waiting times scandal illustrates the situation perfectly. You want it to look like vets are only waiting two weeks for an appointment? OK, I’ll make the data look like that… even if that’s not reality.
See here:
https://www.leanblog.org/2014/05/the-real-va-scandal-is-the-long-waiting-times-bad-management-not-gaming-by-bad-apples/
I would go further to suggest that chasing metrics, in general, regardless of the metrics is the wrong methodology entirely. Chase warranty costs, for example, and you succeed in doing one thing – annoying your customer. Chase top line, and you will sacrifice bottom line. Chase on-time, and you also sacrifice bottom line.
This metrics approach takes hold in large corporations especially because, when a firm gets to a certain size, it is literally impossible for senior managers to do anything except manage metrics. Further, this metrics approach is demoralizing because all the senior managers do is beat you up, and there’s ALWAYS a metric that slips.
The only real approach is to develop a continuous improvement attitude and push rocks out of the way of your production…all day long. Then the metrics will follow as the business gets better.
Just my opinion, having been in manufacturing management for twenty years this years (and I have yet to see it “done right” by the way)
I agree with you, Brian. I think the “Balanced Scorecard” type approach to metrics (keeping 4 or 5 key areas in balance) can help, but not everything is easily measurable (such as how well your product fits customer needs, customer satisfaction, etc.). There are measures, yes, but they’re flawed in some way, so judgment and long-term thinking matters too. Thanks for commenting!
[…] union for the company’s problems. I blamed leadership (or a lack thereof, as I wrote about here and […]
[…] The pressure to “make the numbers” isn’t just a healthcare problem. I saw the same thing in manufacturing, including this story from my GM days. […]
[…] thought everybody needed to develop more of a “sense of urgency” (which is a phrase I used to hear at GM 20 years ago… a phrase and slogan that never really […]
[…] and control culture — and everybody suffered: customers, employees, shareholders. But, some managers got to yell and scream at others, acting like the tough guy. But, employees (including me) laughed at them behind their backs. […]
[…] GM Got Gamed (Or, How to Fudge Your Production Numbers) […]