Visualizing Metrics & Managing Improvement Properly: Webinar Registration Numbers

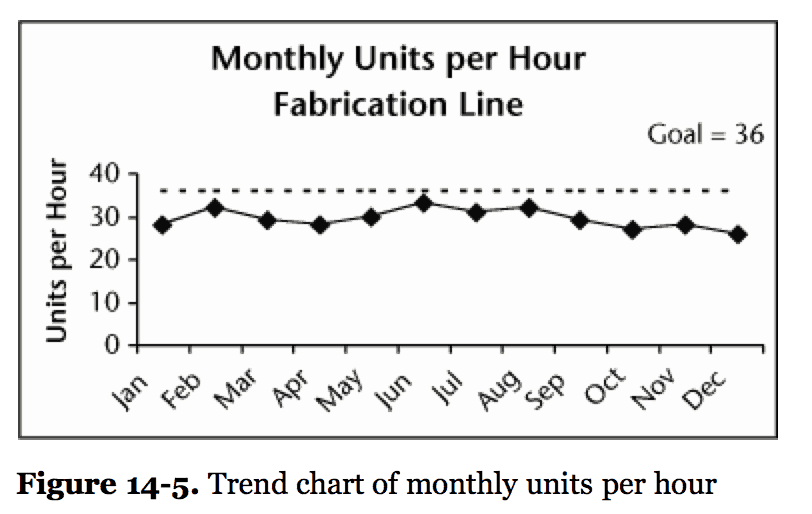
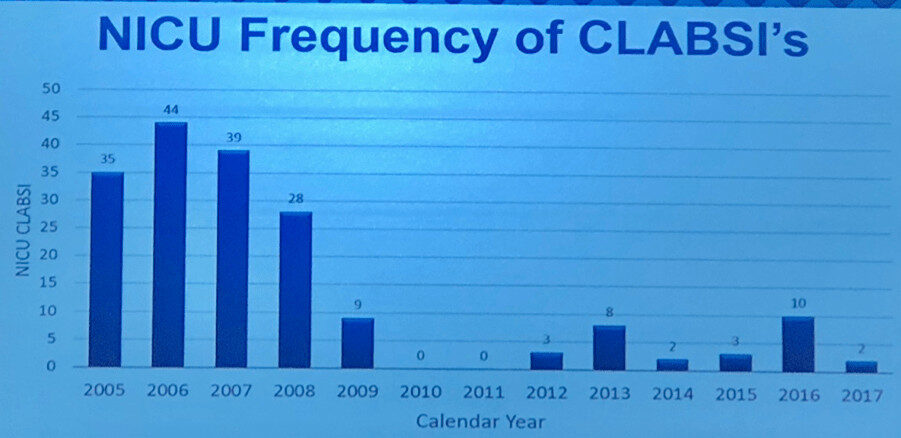
When managing a process and looking at results, the type of chart we use matters. The way we react to the chart matters too. In this blog post, I explore two different types of charts and explain why I like the "process behavior chart" format better.