Ten Psychological Safety Outcomes, and What They Do and Don’t Prove
The second revised (and expanded) edition of Timothy R. Clark's The 4 Stages of Psychological Safety came out this week. My copy showed up yesterday, and I've been working through it.
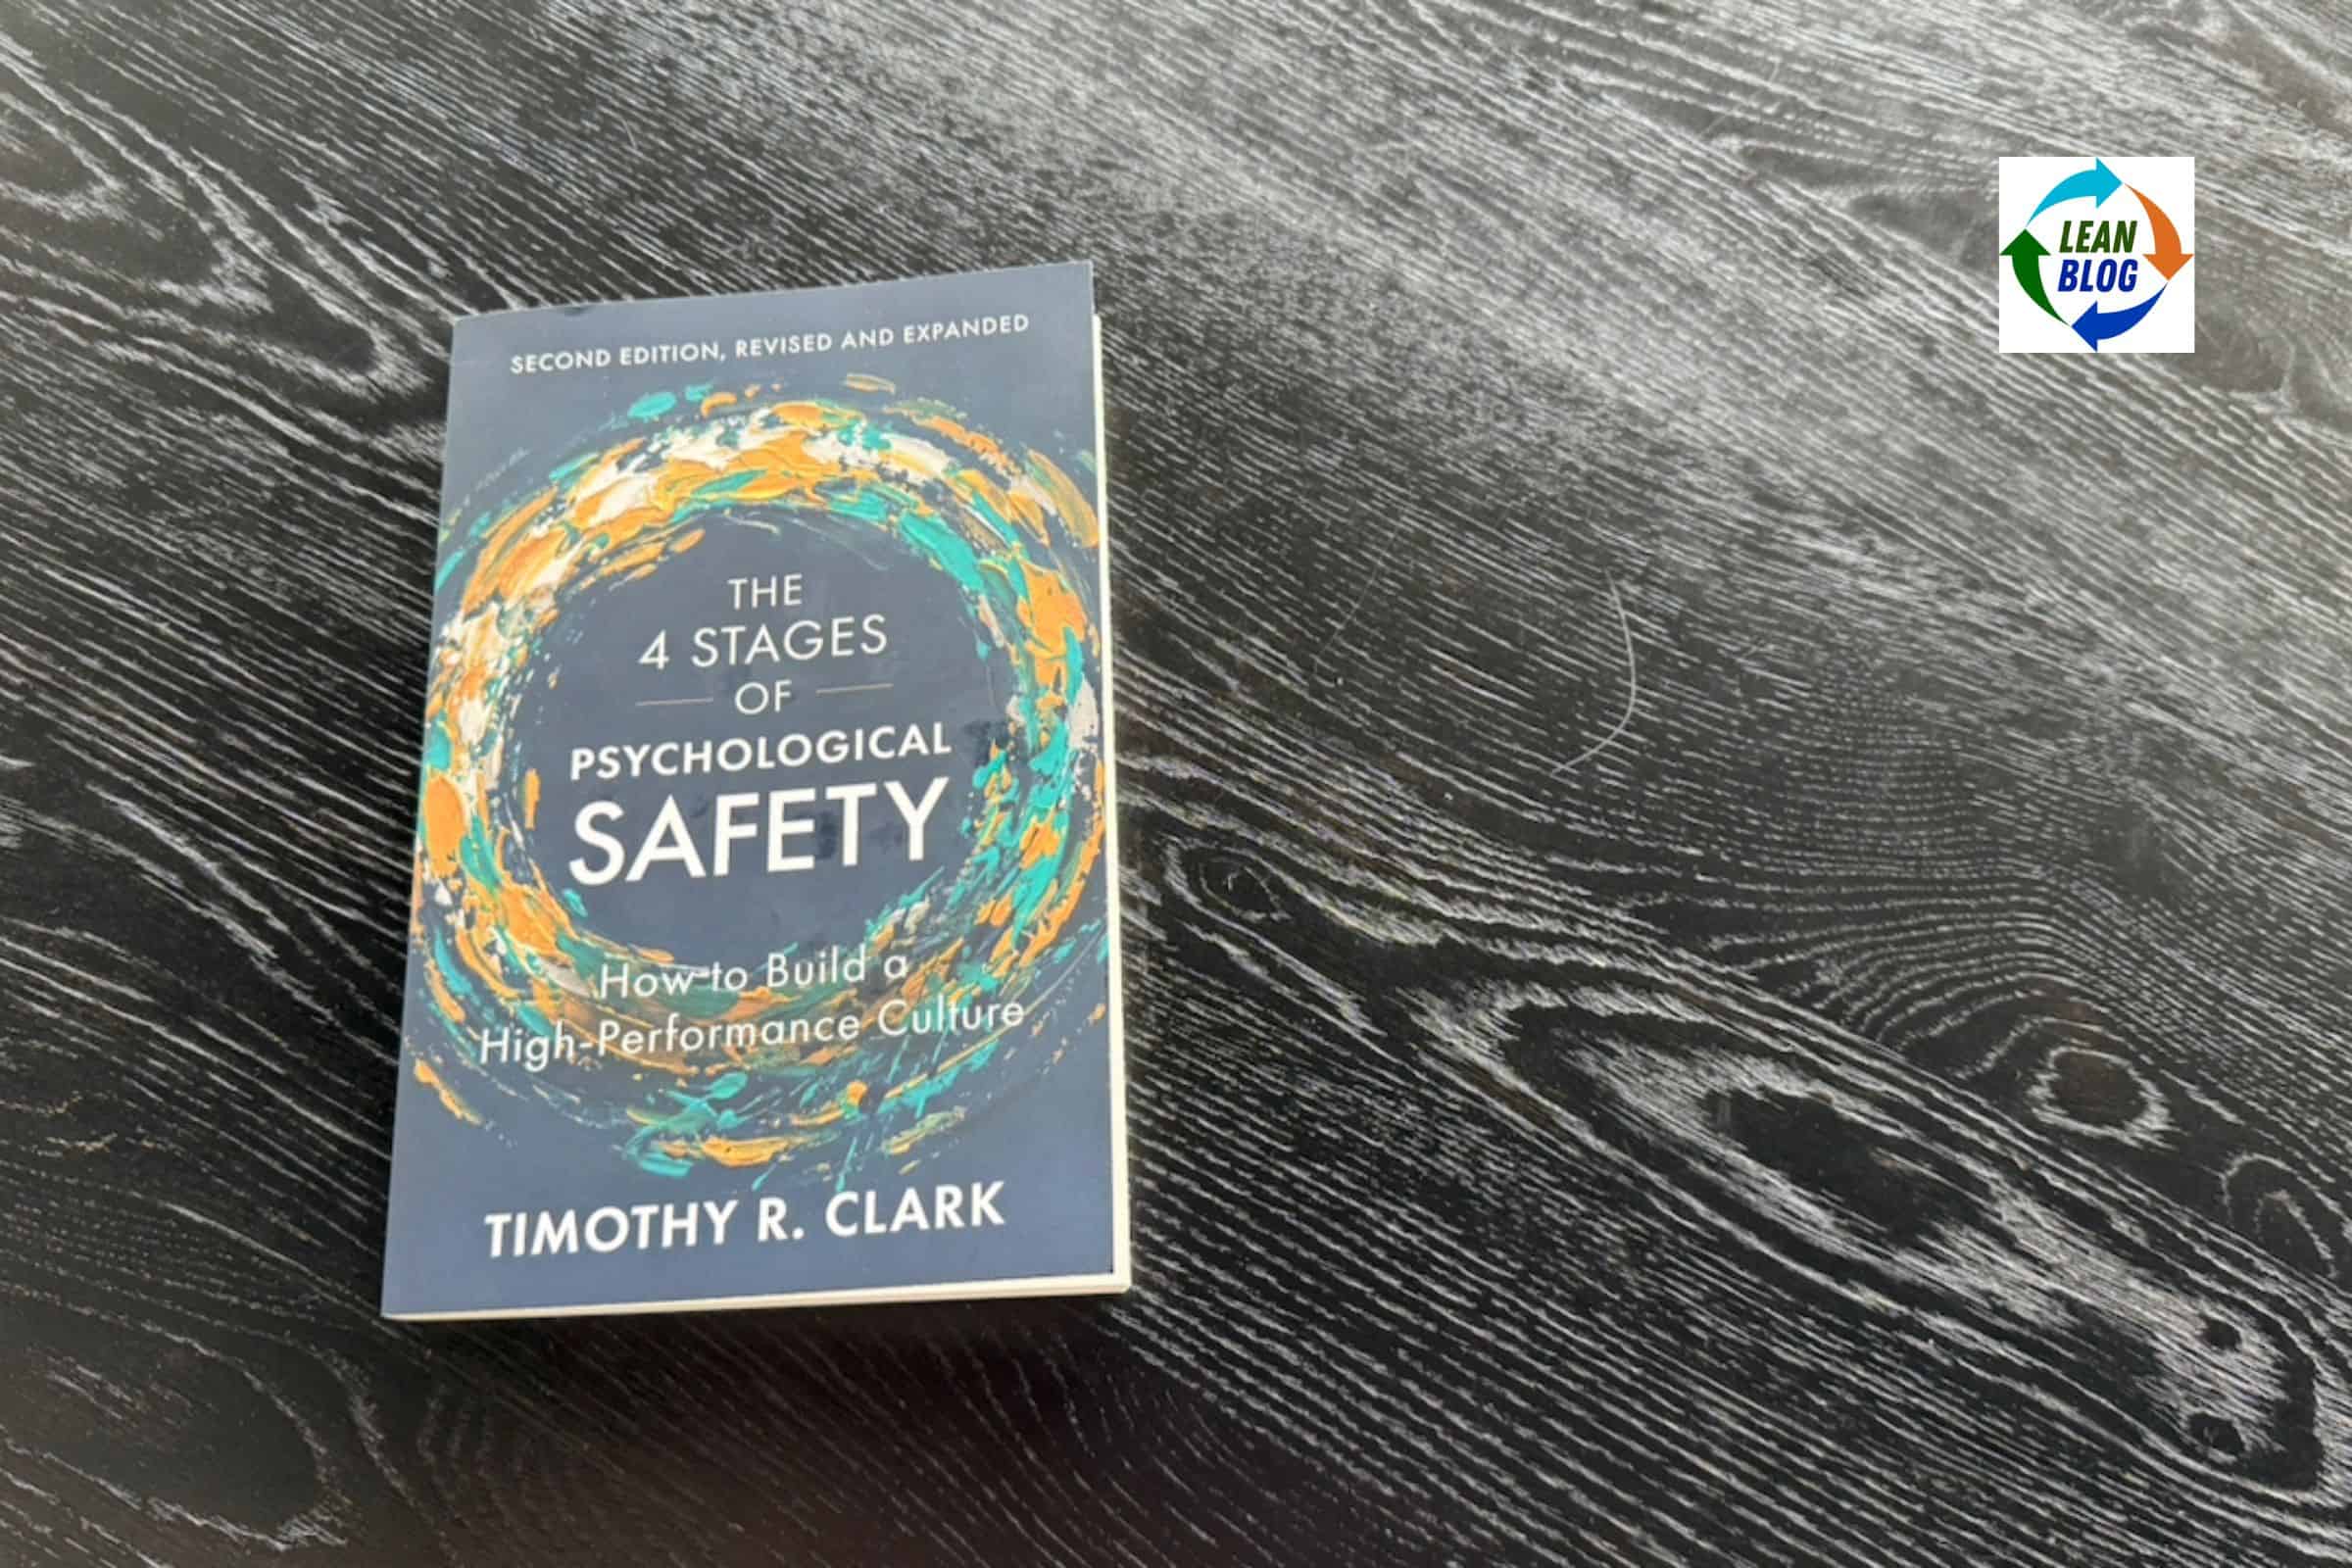
I've learned a lot from Tim over the years. The first edition gave me language I didn't have for things I'd been trying to describe for a decade, and I went through LeaderFactor's 4 Stages certification, which sharpened it further. He was also generous enough to join me on My Favorite Mistake, Episode 217, where he told a story about hiring the wrong person twice for the same reason. I'm hoping to have him back on to talk about the new edition.
So this isn't a neutral review. It's an enthusiastic one with a caveat about how I'd present one piece of the evidence.
Ten arrows out of one box
A few pages into the introduction, there's a figure with ten arrows fanning out from a single point. Psychological safety is the x. The ten psychological safety outcomes are the y's — this should all get your attention.
- Inclusion
- Team performance
- Resilience
- Physical safety
- Wellness
- Engagement
- Retention
- Learning agility
- Productivity
- Innovation
Number four is the one I'd put in front of a plant manager, in particular, especially in the context of SQDC.
Every operations executive I've worked with says safety is first on the list. Some of them mean it. The ones who mean it have usually never heard anyone connect it to whether people feel able to say “I don't think this is right” out loud. Physical safety and psychological safety get owned by different departments, tracked on different boards, and discussed in different meetings.
Clark walks through the statistics briefly. In social science, a correlation or regression coefficient around .30 is often treated as meaningful, and he calls that “the critical threshold.” His point is that psychological safety clears it for all ten of those outcomes, based on peer-reviewed research he cites in the endnotes. Mostly other people's studies, pulled together in one place.
Tim did a launch webinar yesterday for the new edition:
Here's another recent video on the connection to physical safety:
What the correlations don't establish
Clark is careful in the text about correlation and causation. The figure is less careful, because figures usually are. Ten arrows pointing outward from one box reads as ten things psychological safety produces.
A correlation of .30 accounts for roughly nine percent of the variance. That's a real relationship. It is not a lever that moves an outcome most of the way. And the arrow could point either direction. Teams that perform well may find it easier to be candid, because they aren't under the kind of pressure that makes people hedge. Or a third thing — competent management, adequate staffing, a supervisor who got trained properly — may be producing both.
The ten outcomes also aren't independent of each other. Engagement, retention, productivity, and team performance overlap substantially, both conceptually and in how they get measured. Ten separate findings sounds like ten separate confirmations. It's closer to a handful of related findings measured several ways.
None of that makes the evidence weak. It makes it evidence, which is different from proof, and I think Lean people in particular should be comfortable saying so. We spend a lot of time telling people not to overreact to a single data point or confuse correlation with root cause. We shouldn't suspend that when the finding agrees with us.
There's also a box missing on the left side of the figure.
The ten items are outcomes. Psychological safety is what produces them.
But psychological safety is an outcome too.
It doesn't appear because it's on a values slide or because somebody declared the team a safe space. It gets produced, or it doesn't, by what leaders and colleagues do in ordinary moments. How a manager reacts the first time somebody brings bad news. Whether the person who asked the obvious question got thanked or got a look. What happened to the operator who stopped the line and turned out to be wrong.
So the chain has at least three links. Behaviors, then safety, then the ten y's. The figure shows the last two. The first one is the only part a leader can act on directly, and it's the part that isn't in the picture.
How I'd actually use it
Here's the version I'd say in a room, and I think it holds up better than the chart does:
Psychological safety shows a positive relationship with ten outcomes organizations already care about, across a lot of studies, in a lot of countries. Nobody has proven the direction of causation. But there's no plausible story in which people seeing problems and not mentioning them makes any of those ten numbers better.
That second part is what lands. The executive doesn't need certainty about effect size. They need to notice that the alternative has no upside anywhere on the list.
If someone wants the underlying research rather than a summary of it, Lance Frazier at Creighton University and colleagues published a meta-analysis in 2017 pooling 136 independent samples: more than 22,000 people, nearly 5,000 teams. Most of what it pools is correlational too. Pooling correlations doesn't produce causation. What it tells you is that the pattern isn't an artifact of one sample, one industry, or one country.
The Lean read
Look at items 4, 8, and 10 together: physical safety, learning agility, innovation.
Those are three different names for what happens after somebody says something. A near miss gets reported instead of shrugged off. An operator admits she doesn't know the procedure rather than guessing. Somebody says the countermeasure didn't work, so the next PDSA cycle starts from better information instead of a slide that says green.
An andon cord assumes a person will pull it. A huddle board assumes somebody will raise the red item. A suggestion system assumes people believe suggestions go somewhere. We built all of that on an assumption about human behavior and then mostly stopped talking about the assumption.
Tim put the hierarchy problem plainly on the podcast: “That's why the overhead crane operator does not challenge the foreman on the shop floor.” He also has a phrase I've used many times since, “rhetorical reassurance,” for what happens when a leader stands up and announces that this is now a place where people can speak up. Nothing changed except the announcement. As he put it, you can't legislate it with your words.
Which is another way of saying psychological safety is a y, not just an x.
What's new in the second edition
Per the publisher, the new edition adds quantitative evidence from LeaderFactor's assessment database, described as 1.2 million data points, plus new chapters on what psychological safety is not, on the problems with “nice” cultures, on the relationship between psychological and physical safety, and on measurement. I'd verify that database figure against the book before quoting it — I'm going off the publisher's description there.
The chapter on nice cultures is the one I'm most curious about. Kind and nice are not the same thing, and the gap between them is where a lot of teams get stuck. Everyone is pleasant, nobody says the schedule won't hold, and the project ships late anyway.
Learner safety is still the stage I find myself explaining most often to Lean audiences. If somebody asks a question after training and gets “but you went through the training,” they've just been taught what not to do next time.
I'll have more once I'm through the new material. If you've read the second edition already, I'd be interested in what changed or stood out for you.