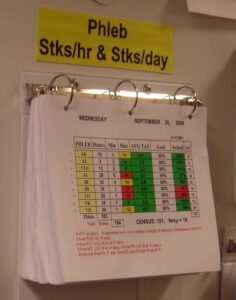


What Your Red/Green Metrics Look Like to a Color Blind Leader (and a Dog)
In 2014, over dinner with a workflow facilitator from a Florida health system, I had an idea that I thought was very funny at the time… well, I still think it's funny.
We were talking about strategy deployment walls, those big boards where leaders review metrics that are coded red or green. And I asked, out loud, in a restaurant, “What would happen if a dog reviewed the metrics wall?” There was laughter. It may have been the wine. It was probably the wine. But a few weeks later, we had a cartoon.
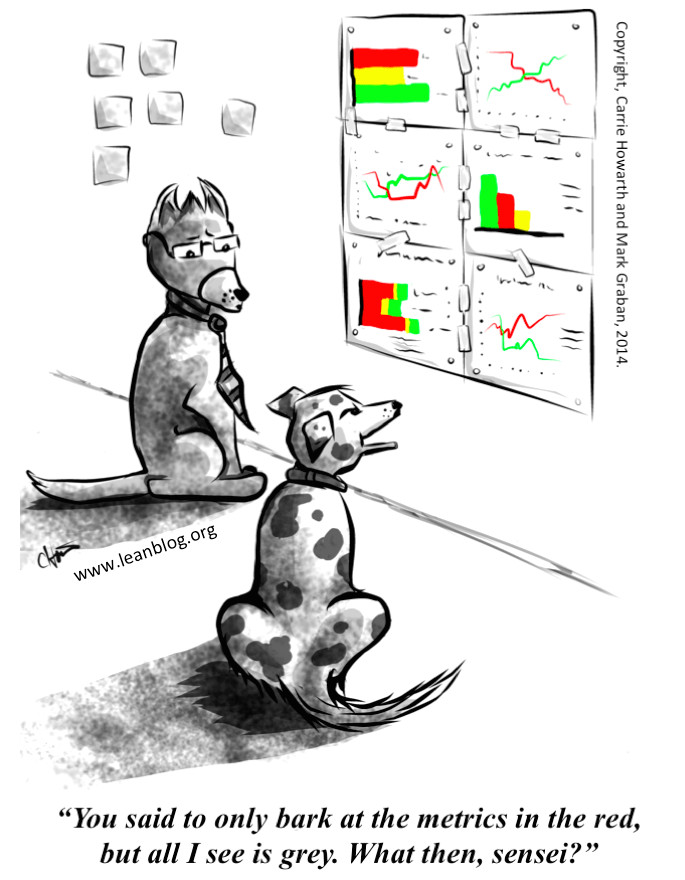
The dog in the cartoon says all he sees is grey. Even back in 2014, I had to add a footnote correcting my own cartoon: the dog is wrong. Dogs see color. They just see red and green both as roughly yellow. So the dog isn't looking at a wall of good news and bad news, and he isn't looking at a wall of grey. He's looking at a wall of metrics that are all, as far as he can tell, “at risk.”
The dog doesn't know whether to bark. That puts him in the same position as many managers, except nobody asks the dog to fill out a project charter by Friday.
Red/green metrics and color blindness
Here's the part that's less funny. According to the Cleveland Clinic, color blindness affects about 1 in 12 men and 1 in 200 women, and the most common form is red-green (as reported by Live Science).
So we've built a management system where the most important information on the wall is encoded in the two colors that the largest group of color blind people have the most trouble telling apart.
Oops.
Run the numbers on a leadership team. If twelve men sit around the table for a monthly operating review, and each has a 1-in-12 chance of red-green color blindness, there's roughly a two-in-three chance that at least one of them has trouble telling a red cell from a green one. That's math.
I suspect most of those people never say anything. Nobody wants to be the one who interrupts the operating review to ask, “Quick question, which of these is the bad color?” So they figure it out from position, or from what everyone else reacts to, or from whoever looks the most nervous about their number.
The little research I found suggests this isn't a minor annoyance. In a 2021 survey of 810 color blind workers by EnChroma, a company that sells glasses for color blindness, 65% said they have trouble interpreting color-coded materials, and 75% said being color blind slows them down at work (EnChroma). That sample leans toward electricians, lab workers, and other color-heavy jobs, and the company has something to sell, so I wouldn't treat the numbers as precise. But I'd be surprised if managers squinting at a red/green wall were the exception.
Who's going to say something?
I looked for data on how many managers hide their color blindness at work. I didn't find any. So I'll ask the questions I'd want a leadership team to ask itself.
If you're a rising manager and you can't tell the red cells from the green ones, do you feel safe saying so in the operating review? Or does it feel like admitting you can't read the scorecard everyone else reads just fine? And if you did say something, would anything change, or would somebody suggest you sit closer to the screen?
Those are the two questions I ask about speaking up in general: is it safe, and is it worth it? A color blind manager who stays quiet may be making a perfectly rational call on both.
Now compare that with what happens when the person at the top has the same condition. Mark Zuckerberg is red-green color blind. He told The New Yorker in 2010 that “blue is the richest color for me,” and that's why Facebook is blue (The Week's summary of the profile). One person's color vision set the look of a product used by billions of people.
So here's my prediction. If your CEO announces at the next all-hands that he's color blind, you'll have new dashboards by Friday. Nothing will ever be red or green again. Somebody in IT will get a spot bonus. If a first-year supervisor says the exact same thing, she'll probably get a sympathetic nod and a link to some glasses. Maybe she'll get reimbursed.
Same eyes. Very different response. That gap is about who gets listened to, not about eyesight.
One more thought, and this one is speculation. A color blind manager who can't trust the colors might quietly start plotting the numbers as a line, just to see what's going on. If so, his workaround is better than the official scorecard. He's adopted a better method because the standard one didn't work for him. If you've done exactly that, I'd love to hear about it.
What traffic lights figured out a long time ago
Traffic lights use the same two colors, and color blind drivers manage fine. That's because a traffic light doesn't rely on color alone.
First, position. In the U.S., the Manual on Uniform Traffic Control Devices fixes the order: red on top and green on the bottom for vertical signals, red on the left for horizontal ones (MUTCD signal arrangements). A driver who can't tell the colors apart still knows which light is on.
Second, the colors were nudged apart, and that fix came from a color-blind engineer. In 1856, William Pole, a British civil engineer who was color blind himself, presented a paper to the Royal Society about his own case. Railways and ships already used red and green signals, and he suggested a simple fix: make the green a blue-green and the red a yellowish red, so color-blind people could tell them apart as easily as anyone else. By 1948, a National Bureau of Standards paper reported that marine and railway signal specifications paired a slightly yellowish red with a green that had no yellow in it, and that highway stop-and-go signals mostly did the same (Judd, NBS, 1948). If you've ever thought a green light looked a little teal, that's on purpose.
Notice how that happened. Pole argued that color blind people were “really in a better position” to study the problem than the normal-eyed (Pole, 1859). The Royal Society agreed. Sir John Herschel reviewed the paper and called it valuable specifically because it came from someone who had the condition and could describe it scientifically (Royal Society archive). A person with the problem spoke up, the experts listened, and his idea is still hanging over intersections 170 years later. Victorian England managed that. Your weekly operating review can probably manage it too.
Third, some places add shape. In Prince Edward Island and parts of Quebec, horizontal signals use a square for red, a diamond for yellow, and a circle for green (Islands).
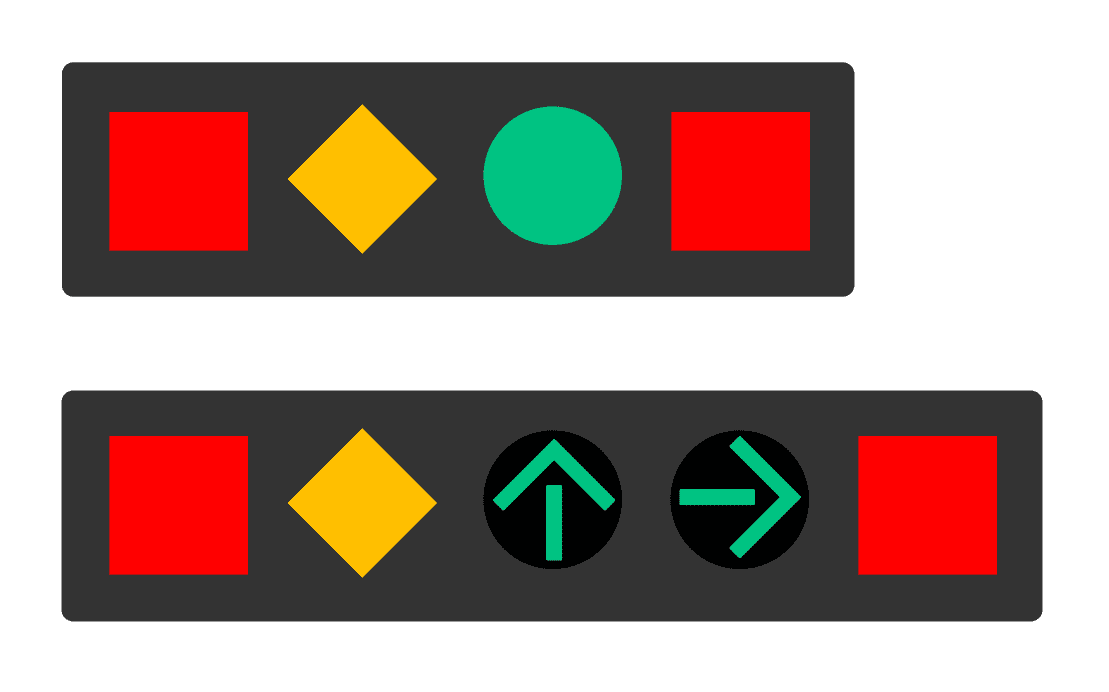
Our scorecards borrowed the colors from the traffic light and left out all three of the things that make it work. Every cell on a red/green scorecard sits in the same kind of box. The color does all the work, and for some of your leaders, it isn't doing any.
If you're going to keep color-coding, steal from the traffic engineers:
- Use a bluish green and an orange-leaning red. A widely used color-blind-safe palette lands on the same idea, with a “bluish green” and a “vermillion” (Color Universal Design).
- Make the colors different in lightness, too, so they survive a bad projector or a grayscale printout.
- Add shapes, the way Prince Edward Island did. Put a square or an X in the red cells and a circle or a check mark in the green ones, or just write “above target” and “below target.” It's not glamorous, but neither is a scorecard, and now everyone in the room can read it. Color should never be the only signal. That's also a basic web accessibility guideline (WCAG, “Use of Color”).
A quick test: print your scorecard in grayscale. If you can still tell what's good and what's bad, congratulations. If you can't, you're now seeing it the way the dog does. And, statistically, the way somebody in your meeting does.
So I tried it. This is where I kept going down a research rabbit hole, which happens to me more often than I'd like to admit. One minute I'm writing about a cartoon dog, and two hours later I'm reading an 1856 paper from the Royal Society.
Anyway, I took a real scorecard (from my book), recolored it a few different ways, and ran each version through a color blindness simulator and a grayscale filter. The worst performer, by a mile, was Excel's default conditional formatting: the light pink and light green fills you get when you click the button and don't think about it. Thanks, Microsoft.
To someone with red-green color blindness, the red cells and the green cells turn into the same shade of beige. I suspect the most common scorecard colors out there are the ones nobody actually chose. The default is a decision, too. Nobody made it on purpose.
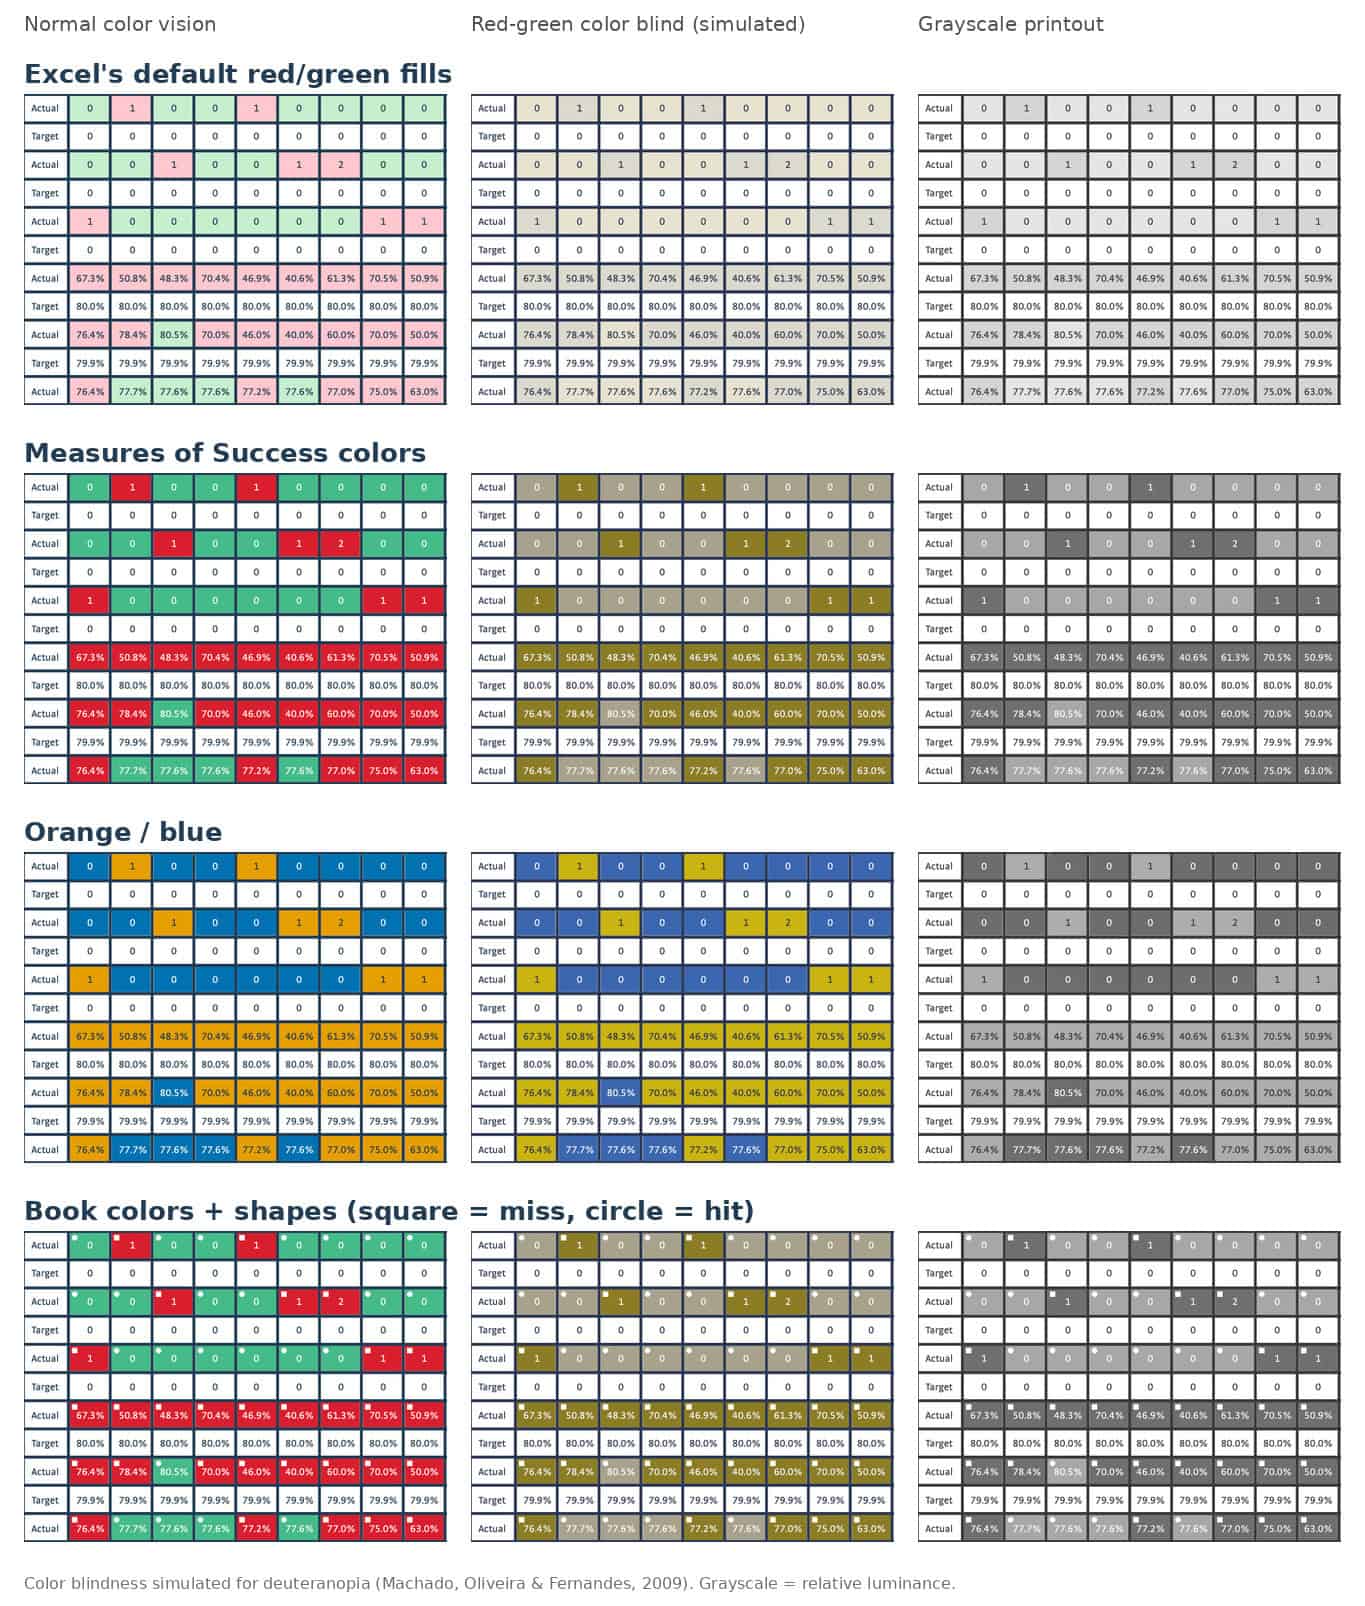
One surprise: the color-blind-safe palette I mentioned earlier, with its vermillion and bluish green, passed the color blindness test but failed the grayscale test. The two colors are about equally dark, so on a black-and-white printout they look almost the same. Orange and blue passed both tests. So did adding a small square or circle to each cell, which works no matter what colors you pick.
Naturally, after writing all of this, I went back and checked my own book. Measures of Success has a few red/green bowling chart examples, the very kind of chart I'm arguing against. I measured the colors. The red is a dark crimson, and the green is a lighter, slightly bluish green, so even in grayscale one is clearly darker than the other. The numbers and the targets are printed right in the cells, too. The charts pass the test.
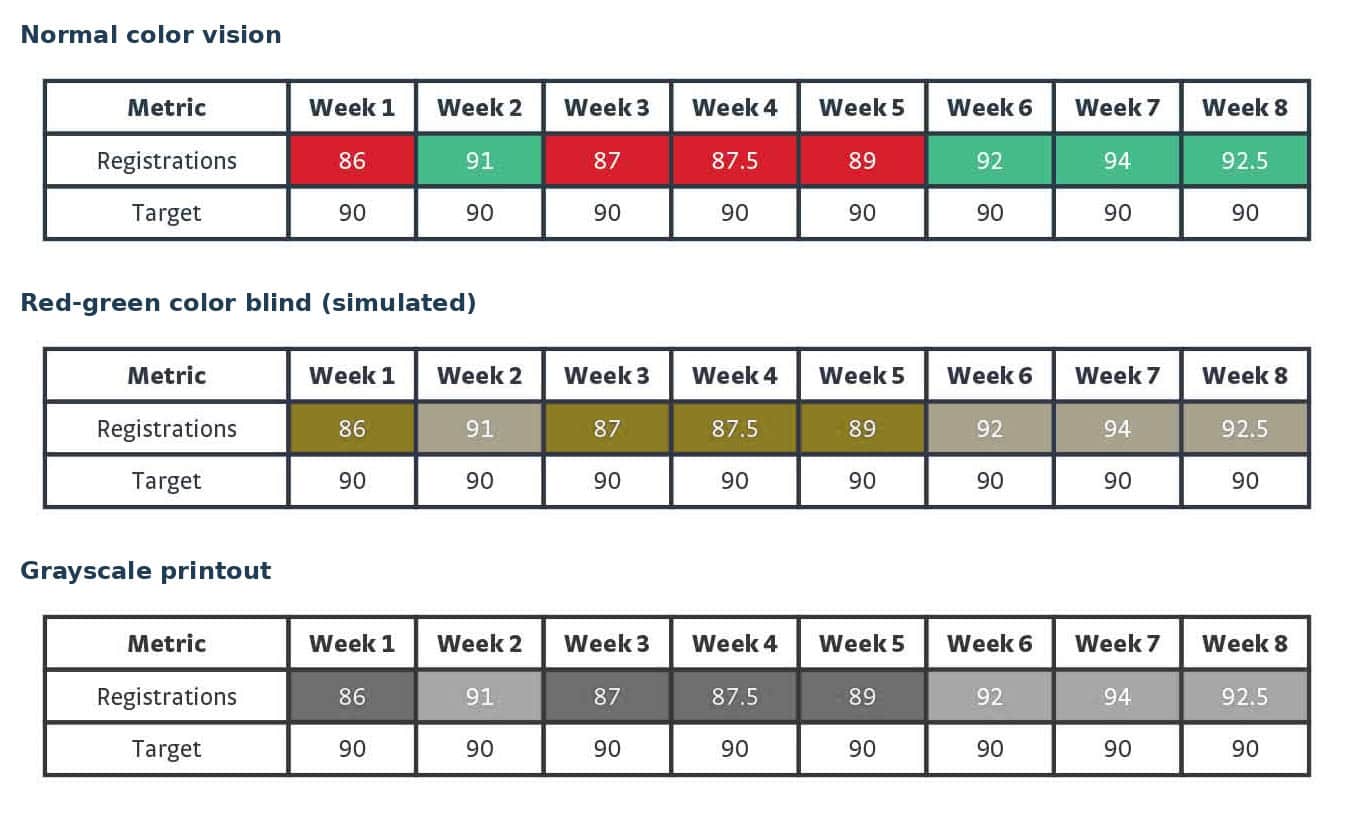
I'd love to tell you that was a carefully considered accessibility decision. It was not. I got lucky. The colors were picked because they looked good, and “looked good” thanksfully happened to also mean “readable by the one in twelve.” I'll take it. But being lucky isn't the same as being good, and the only way I found out which one I was is that I checked. That's the whole point of this post, really. Don't assume. Check.
Perfect color vision doesn't help much either
I'd like to tell you that if we just fix the colors, everything's fine. I would really like to tell you that.
But even for those of us who see red and green just fine, the colors answer only one question: did this month's number hit the target? They don't tell you whether anything changed.
I've written about this before, including how we miss signals when we rely on red/green analysis, why red, amber, and green charts aren't state of the art, and why “bowling charts” aren't state-of-the-art management either. The short version: a metric that sits right around its target will flip between red and green on its own, month after month, with nothing changing in the system. Leaders react to every red cell, ask for an explanation, and hand out credit when the next month turns green. The explanation was a guess. The credit was a coin flip. Everybody leaves the meeting feeling like they managed something.
Meanwhile, a metric that's been green all year can be getting steadily worse, and nobody asks about it, because green means “nothing to see here.” Right up until it doesn't.
The colors also invite rules of thumb like “investigate after two reds in a row.” Two reds in a row is not a trend. It's two reds in a row. For a metric near its target, it happens by chance more often than most people expect. And as I've written before, red isn't always bad, or even meaningful. Sometimes it just means the number landed on the wrong side of a line somebody drew in a budget meeting.
A chart that doesn't depend on color
When I put the cartoon next to a Process Behavior Chart, I noticed something. The chart doesn't need color to make its point.
A Process Behavior Chart plots the data over time, with an average and two limits calculated from the data. You react when a point lands outside the limits, when there's a run of eight in a row on one side of the average, or when three out of four points are closer to the same limit than to the average. Everything else is routine variation, and the useful question becomes how to improve the system, not what went wrong last month.
Every one of those rules is about position: above, below, outside, in a row. None of them is about hue. The chart's version of “which light is on” is where the point sits. Print the chart in grayscale, show it to someone with red-green color blindness, or hand it to the dog, and the signals are still there. If you want the target visible, shade it as a background band. The band still works in shades of gray.
That's not the main reason to use Process Behavior Charts. The main reason is that they answer the question the colors can't: is this a real change, or just noise? But it's a nice bonus that the better method is also the more accessible one. As far as I know, it's the only management tool that works equally well for people, color blind people, and dogs.
Try the grayscale test this week
Pick one row of your scorecard, the one that generated the most discussion last month. Print it in black and white. Then plot the last twenty or so data points as a line, with the average and limits. Put them side by side.
If the scorecard row tells you nothing without its colors, and the chart still tells you whether anything changed, you've learned something about the scorecard. Some of your colleagues may have known it all along. They just weren't asked.
If you'd like more on reading these charts, my free guide What Your Scorecard Isn't Telling You walks through four sites' worth of red and green metrics and what the charts show instead. And if you'd like to feel variation for yourself, the Red Bead Game simulator takes about ten minutes.
The dog, for the record, has not responded to requests for comment.