

The One Where a Dog Reviews the Strategy Deployment Metrics Wall
I've had some cartoons on the blog before, including a few “Doofus & Leanies.” I can't draw at all, believe me (although I sometimes do my own simple digital graphics).
I've been fortunate to partner up with other artists before and today's cartoon is a new collaboration with Carrie Schurman, CMA (AAMA), a workflow facilitator at a health system in Florida.
A creative moment often occurs over a glass of wine with colleagues. We were talking about the Lean practice of “strategy deployment” and how senior executives review key metrics on a monthly basis or more frequently.
It's often said that strategy deployment is a “management by exception” process, where leaders are supposed to focus first on metrics that are “in the red,” meaning behind plan or below a target. Let's ignore, for the moment, the Deming argument against comparison to potentially arbitrary targets.
Ack, this intro is going longer than I wanted.
So, we have metrics that are “red” or “green” in status. There is some controversy over the use of “yellow” as an intermediate zone for a metric. More on that in a bit.
At this dinner, I wondered aloud, “What would happen if a dog was reviewing the red and green metrics??” There was laughter around the table (it could have been the wine).
Long story short, it led to me reaching to Carrie to partner up on a cartoon. She's involved with Lean, has a great perspective on it, is funny (in her tweets), and is an artist. It led to this, an homage to The New Yorker's famous cartoon “On the internet, nobody knows you're a dog.”
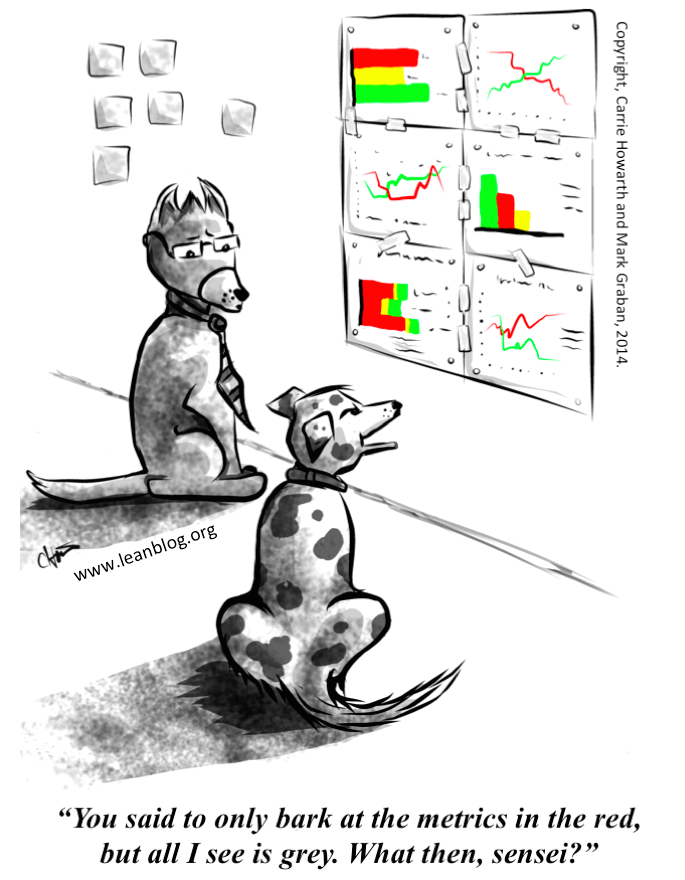
I know a joke isn't really funny if you have to explain the joke… but it's “common knowledge” that dogs are color blind. The dog would just see a bunch of “grey” metrics and wouldn't know how to react.
In reality, dogs can see a LIMITED color spectrum, not just grey. I didn't know that until a few days ago.
As described at dog-vision.com, this limited visibility means that red and green both appear YELLOW to a dog. It goes to show how “common knowledge” and “conventional wisdom” can be wrong, eh?
So, we'd have the same outrageous, but funny, situation where the dog would see metrics that are all yellow, in that range of not being good enough to be green, but not being bad enough to be red. Yellow, yellow, and yellow instead of red, yellow, and green.
Anyhoo, I hope my over-explaining hasn't killed the joke. As I explained to Carrie when I pitched the idea, this joke is probably very funny to maybe 17 people in the world. If you don't get it… go learn more about strategy deployment. One resource is a DVD that I produced when I worked for LEI, sold by the ThedaCare Center for Healthcare Value: “THINKING LEAN AT THEDACARE: STRATEGY DEPLOYMENT.”
You can see more of Carrie's artwork on her Tumblr site: http://theorganconspiracy.tumblr.com/
We're working on a second cartoon (my concept again, her wonderful artwork). Time will tell if time allows for this to become any sort of regular series or anything.
Caption Contest, Coffee Mugs, and Prints:
I played around with many different captions for the cartoon, including:
- “So how am I supposed to react to the metrics that are grey?”
- “You said to only discuss the metrics in the red, but what about the grey ones?”
- “You said to only bark at the metrics in the red, but what about the grey ones?”
If you can come up with a BETTER caption, leave a comment below. The best caption, if deemed (by me) to be funnier will receive a LeanBlog coffee mug with the cartoon on it.
You can also order a mug for yourself, if you like. One is on the way to Carrie as my thanks! I'm splitting proceeds with her 50/50 on any sales.
Or, you can buy a photo print or a 12″ x 12″ canvas print if this strikes your fancy.


Sensei, if I can’t understand this, do the humans? I thought these metrics were supposed to be easy to understand and tell a story? Is this story called Chaos?
Or
I thought these were working documents master, this looks like a Salvador Dali painting. isn’t making these pretty on a computer a waste?
By George (submitted via email):
“If we’re embracing scientific thinking, why do I see so many shades of grey?”
My contributions (I couldn’t resist):
“Yeh Rex, I can’t tell either. Let’s see if it smells like we’re doing better”
“I can’t tell if we’re hitting our targets. Let’s go for a walk and then play some catchball”
“These charts are terrible. I’d get more information from sniffing your butt”
“Looks like our performance is gray again. Grrr. Why do we still leave strategic planning up to the Weimeraners?”
Huh, catch ball.
Would it be “fetch ball” for Strategy Dog-ployment?
Sensei: What do you think?
Pupil: I dont know about you, but its all grey to me.
-or-
Pupil: Um, did the grey mean good or bad?
-or-
Pupil: So these are the fifty shades of grey everyone’s been barking about!
“These graphs go on, and on, andon.”
“Looks like we need to do some katzen.”
… Trying too hard…
I vote for
“fetchball for Strategy Dog-ployment”, or
“I’d get more information from sniffing…”
I was not going to touch the fifty shades of grey…
I think this may go “paper viral” on a lot of lean boards.
LöL.
Is “kat-zen” the dogs blaming the cats? That’s not very Lean to blame like that.
I did hear that Carrie’s tweet (the one above about standardized work and kittens dying) “went viral” on at least one Lean board somewhere in the U.S.
This is just proof to me that it’s a common issue (the writing of standard work for standard work’s sake, not the kittens.. I hope).
It’s a VERY common dysfunction.
Right in the beginning of my “Lean Hospitals” chapter on standardized work, I emphasize the PROBLEMS that occur when you don’t have standardized work – patient harm, infections, etc.
I also wrote: “Standardized work starts with a simple premise: People should analyze their work and define the way that best meets the needs of all stakeholders.”
I hoped that was pretty clear to put the goals / needs first.
I also tried to emphasize that good standardized work documents explain WHY things should be done a certain way — to what benefit and what outcome?
“All grey to me Sensei. Doesn’t matter. As senior manager nobody knows you’re a dog.”
Hope this doesn’t offend too many people. Can you imagine having a mug on your desk with this text and the senior manager walks in? :)
Okay, here’s a try…
“I work like a dog all day long, how the heck am I supposed to know what this means?”
“Sensei, the answer is yellow, yellow, yellow. Can I have my treat now?”
“If the line goes up, does that mean I get to go outside and play?”
Hi Mark, can you wrote:
“There is some controversy over the use of “yellow” as an intermediate zone for a metric. More on that in a bit.”
Can you expand more in that topic, in our hospital we have only red and green, if we get 9.0 and the target is 9.2, it is a red one.
In your opinion what are the benefits for having yellow in the metrics?
Thank you for all your help. Regards.
Hi Karina-
I’m not a fan of overly simplistic red/green comparisons to a target and that’s the subject of a future blog post — or read Mike Stoecklein’s excellent post on this topic.
Those who advocate for a “yellow” range would set a target of 9.2. Above 9.2 is green (assuming a higher number is good). Above something like 8.8 might be yellow and 8.4 or below is red.
The problem is that the targets and thresholds are usually pretty arbitrary.
You can have a stable system that will deliver 9.3 in one period and 9.0 in the next. The different might be pure noise, but people are punished or rewarded and they’re made to explain every up and down in the data. That’s not a good use of time and it’s not good management.
Don Wheeler’s book “Understanding Variation” does a great job of explaining all this better.
I gave a talk today and showed this cartoon… somebody in the audience said, “That dog better be named Bark Graban.” LOL.