

What 1,008 Paddles of Red Bead Game Data Taught Me About KPI Reviews
A unit's patient falls go from four to seven. In the monthly operating review, someone is asked what happened. Someone else promises to look into it. The next month, falls drop to three, and the unit manager gets a nod of approval.
Often, nothing changed. The same system produced four, seven, and three. The meeting spent its time explaining noise, and the people in the room left with the wrong lessons about what works.
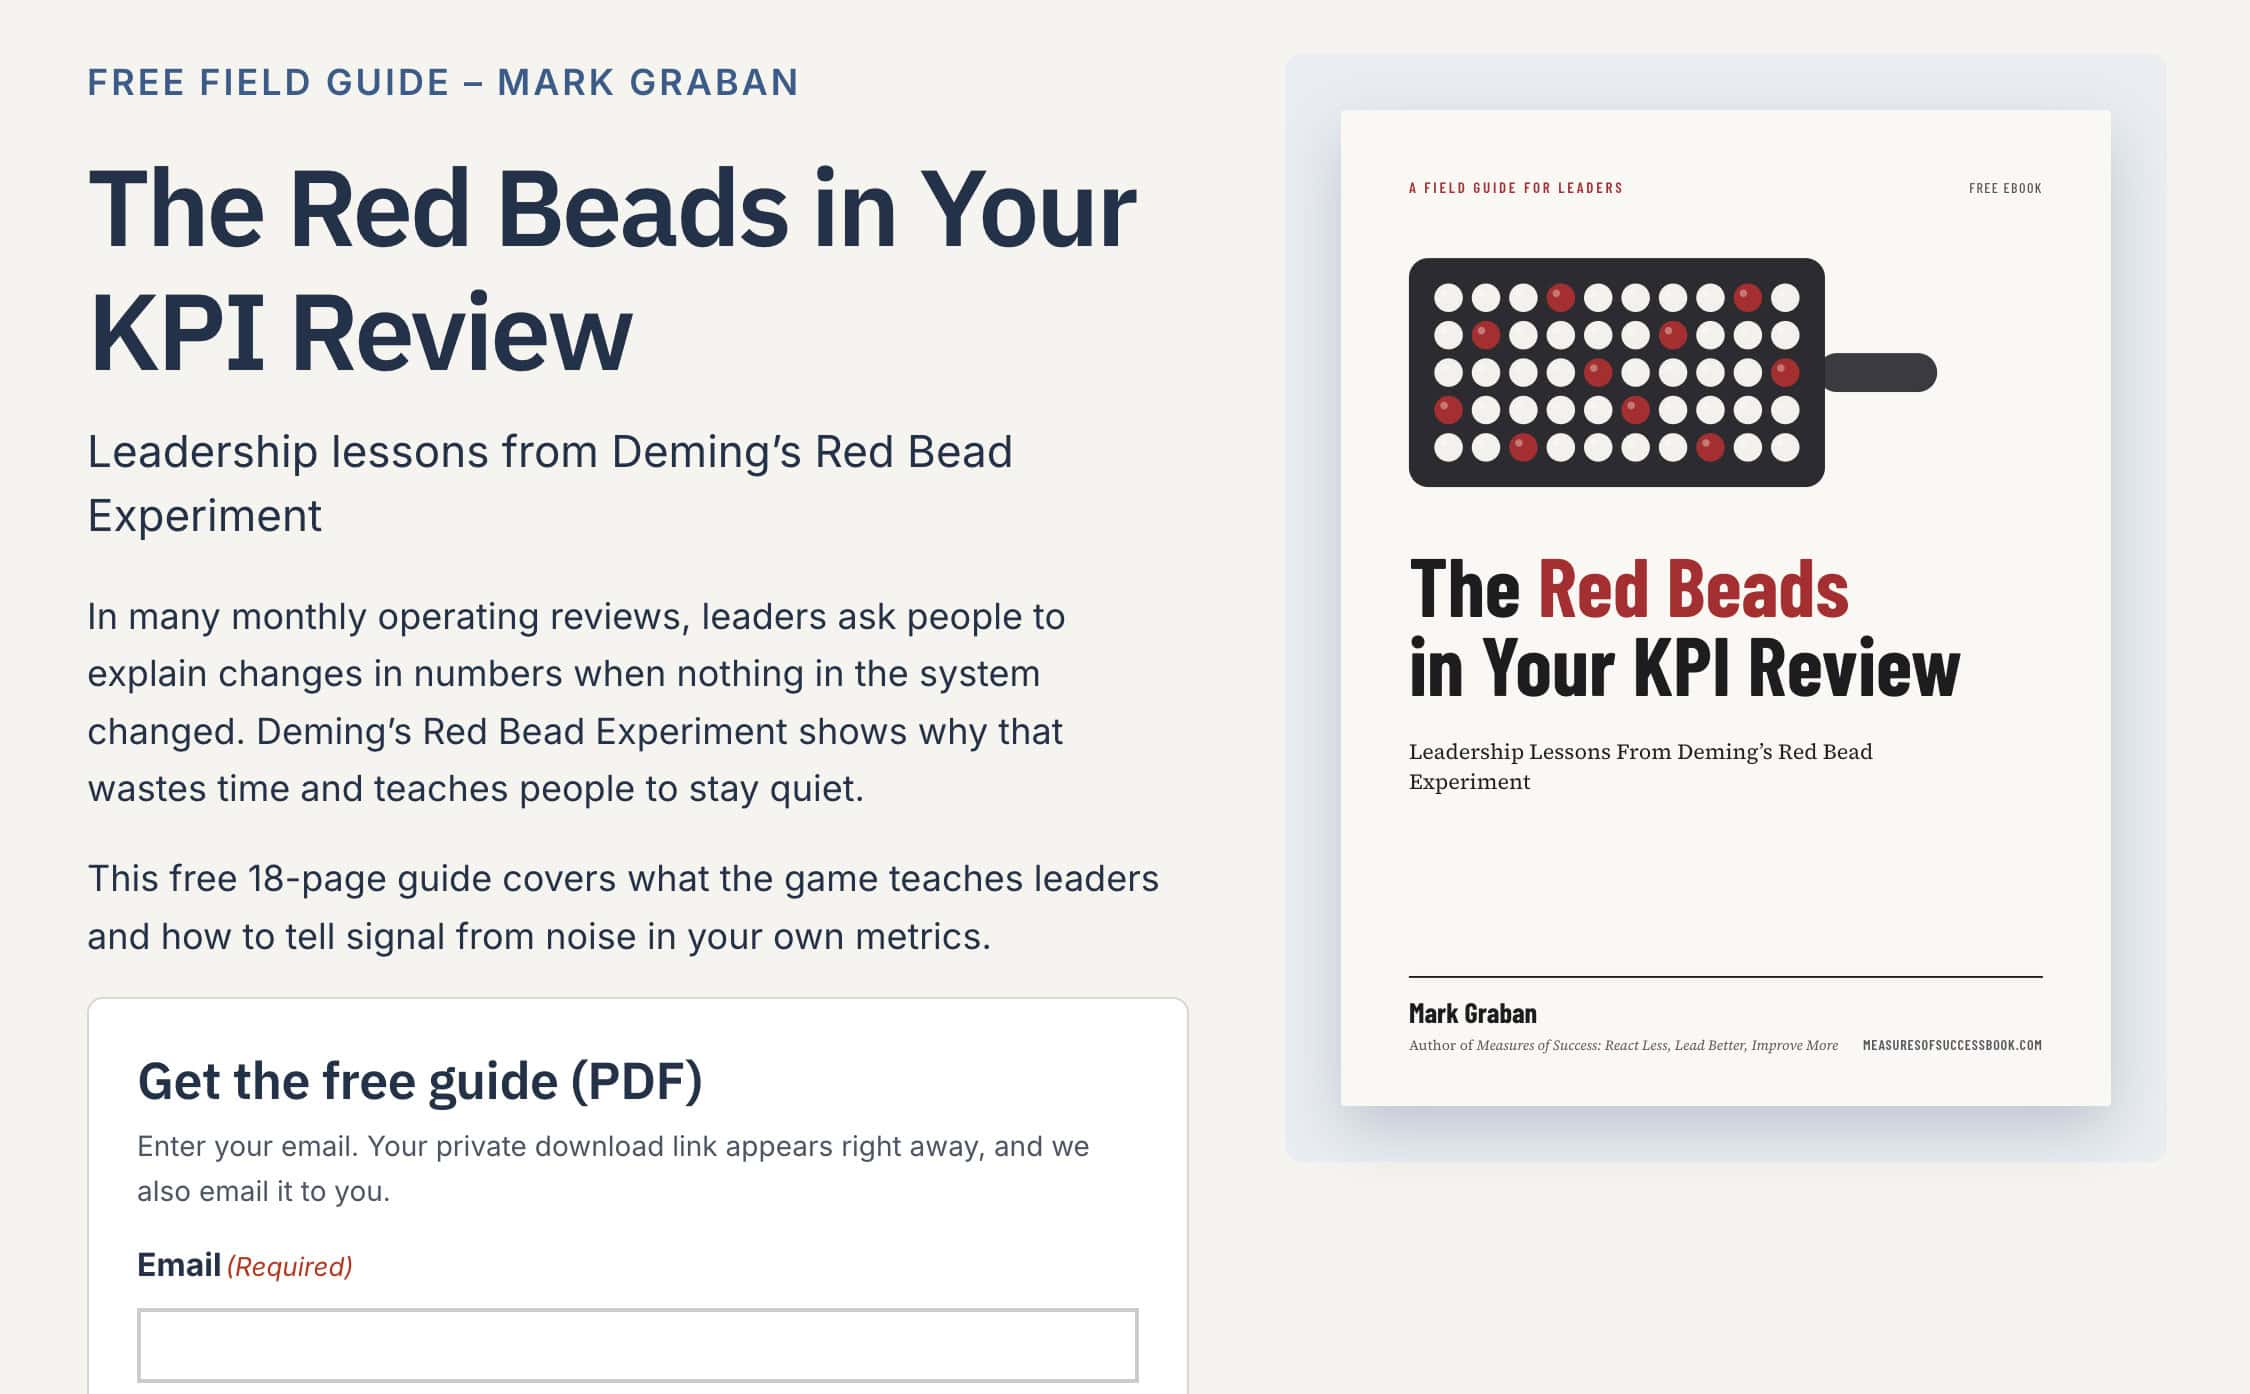
I've used Deming's Red Bead Game to teach this for about 20 years. I've just published a free field guide for leaders, The Red Beads in Your KPI Review: Leadership Lessons From Deming's Red Bead Experiment. Here's a preview of what's in it, including some data from my own workshops that surprised me.
The Red Bead Game in Brief
The Red Bead Experiment was created by Bill Boller of Hewlett-Packard as a gift for W. Edwards Deming in 1982, according to the Deming Institute. Deming used it in his four-day management seminars.
The setup is simple. “Willing workers,” Deming's term for people who come to work wanting to do a good job, dip a paddle with 50 holes into a container of beads. About 20 percent of the beads are red, and red beads are defects. The workers follow a detailed procedure. Inspectors count the red beads, and a recorder writes each number on a flip chart.
Then the manager reacts. The worker with the lowest count gets a certificate. The worker with the highest count goes on probation. Management buys posters, sets a target of three red beads, offers a $20 bonus to anyone who hits it, and eventually lays off the three workers with the most red beads.
The results look the same in every round. The exercise is silly on purpose. It's also an accurate picture of how a lot of organizations review metrics. (I've written more about the leadership lessons from the Red Bead Game before.)
[IMAGE: workshop flip chart. Alt text: Handwritten Red Bead Game flip chart showing red beads by worker and round, with praised results circled]
The Beads Say 10. The Paddle Says 9.6.
I've kept the flip charts from many of my workshops. When I added them up, I had 1,008 paddles from 42 sessions in different countries, venues, and years.
A paddle with 50 holes, dipped into beads that are 20 percent red, should average 10 red beads. My kit averaged 9.6. With that many paddles, a gap that size is very unlikely to be chance.
I don't know exactly why. Something about this paddle and these beads picks up red beads slightly less often than white ones. I would never have predicted 9.6 from the mix. I only found it by counting.
The variation from paddle to paddle matched what random sampling predicts. Session averages varied no more than chance would explain. Forty-two rooms, one system.
That has a practical implication for leaders. You can't decide what a system will produce by declaring what it should produce, and a target doesn't change what the system is capable of. You find out by measuring, and you change the results by changing the system.
Praise and Punishment Both Seem to Work
In the game I describe in the guide, the worker who got the certificate after drawing 4 red beads drew 12 the next round. The worker who was put on probation after drawing 15 drew 11.
A manager watching only those numbers would conclude that praise makes people complacent and pressure makes them focus. Both conclusions are wrong.
An unusually low result tends to be followed by a more typical one, and so does an unusually high result. Statisticians call this regression to the mean. Managers tend to call it proof that their last intervention worked. My guess is that a lot of workplace folklore about motivation was learned exactly this way.
Even the Chart Cries Wolf Sometimes
The tool that helps leaders tell signal from noise is the Process Behavior Chart. It's a run chart with an average and two natural process limits, calculated from the data itself rather than chosen by anyone. Three rules tell you when something has probably changed:
- Rule 1: Any single point outside the limits
- Rule 2: Eight consecutive points on the same side of the average
- Rule 3: Three out of four consecutive points closer to the same limit than to the average
If none of the rules fire, asking “what happened last month?” won't find a cause, because there isn't one to find.
The rules aren't perfect. In my online Red Bead Game simulator, roughly one game in ten shows a signal on the chart, even though the system never changes. The rules balance two risks, reacting to noise and missing a real change, and they don't eliminate either one. That's still far better than guessing, which is what a lot of red-and-green dashboards ask leaders to do.
If you want to build these charts for your own metrics, I've written a step-by-step how-to on the KaiNexus blog, and the full method is in my book Measures of Success.
Why Nobody Spoke Up
When I facilitate the game, I play the manager. In the debrief, someone almost always asks why I didn't let them improve the system.
The willing workers usually have ideas by the first round. Stop putting red beads back in the container. Clean out last month's leftovers before starting. One participant wanted to test whether one color floated so it could be skimmed off. None of that happens, because the manager shuts down every question.
Deming put it plainly at a 1993 seminar: “A bad system will beat a good person every time.”
In a lot of monthly operating reviews, nobody bans questions. People just learn, month after month, that explaining the number is safer than questioning the system. Making speaking up both safe and worthwhile is the leader's job. That's also the focus of my next book, The Silence Tax.
Try This at Your Next Monthly Operating Review
Pick one metric that will come up at your next review, ideally the one that generated the most discussion last time.
Before the meeting, plot its last 20 or so data points and add the average and natural process limits. In the meeting, show the chart instead of the table. Ask “What happened?” only if one of the three rules fires. If there's no signal, spend the time you saved on a better question: what would it take to change this system?
After the meeting, privately ask one person who usually stays quiet whether the discussion felt different.
Get the Free Field Guide
The Red Beads in Your KPI Review is a free 18-page guide. It covers:
- The Red Bead Game in brief, for leaders who haven't played it
- What the game teaches about blame, targets, incentives, and why nobody spoke up
- How to read a Process Behavior Chart, using real red bead data
- More of what 1,008 paddles from 42 workshops showed me
- Red beads in healthcare, manufacturing, and knowledge work, with questions for your leadership team
Download the free guide (email required).
Or play the game yourself first. The online Red Bead Game simulator takes about ten minutes, with no sign-up.
If you'd like to run the live game with your leadership team, I do keynotes, workshops, and coaching, in person or virtually. Here's how we can work together.