

Which Site Would You Call In to Explain? A Red and Green Scorecard Test
Here's a red and green scorecard I use in workshops. (Some organizations call it a RAG scorecard, for red, amber, green.) It shows on-time delivery for four sites over twelve months. Sites 1 and 2 have a 90 percent target; Sites 3 and 4 have a 70 percent target. The trend arrow compares December to November, which is how many scorecards calculate it.
New to process behavior charts? Start with my guide: Process Behavior Charts: A Better Way to Use Metrics Without Overreacting.
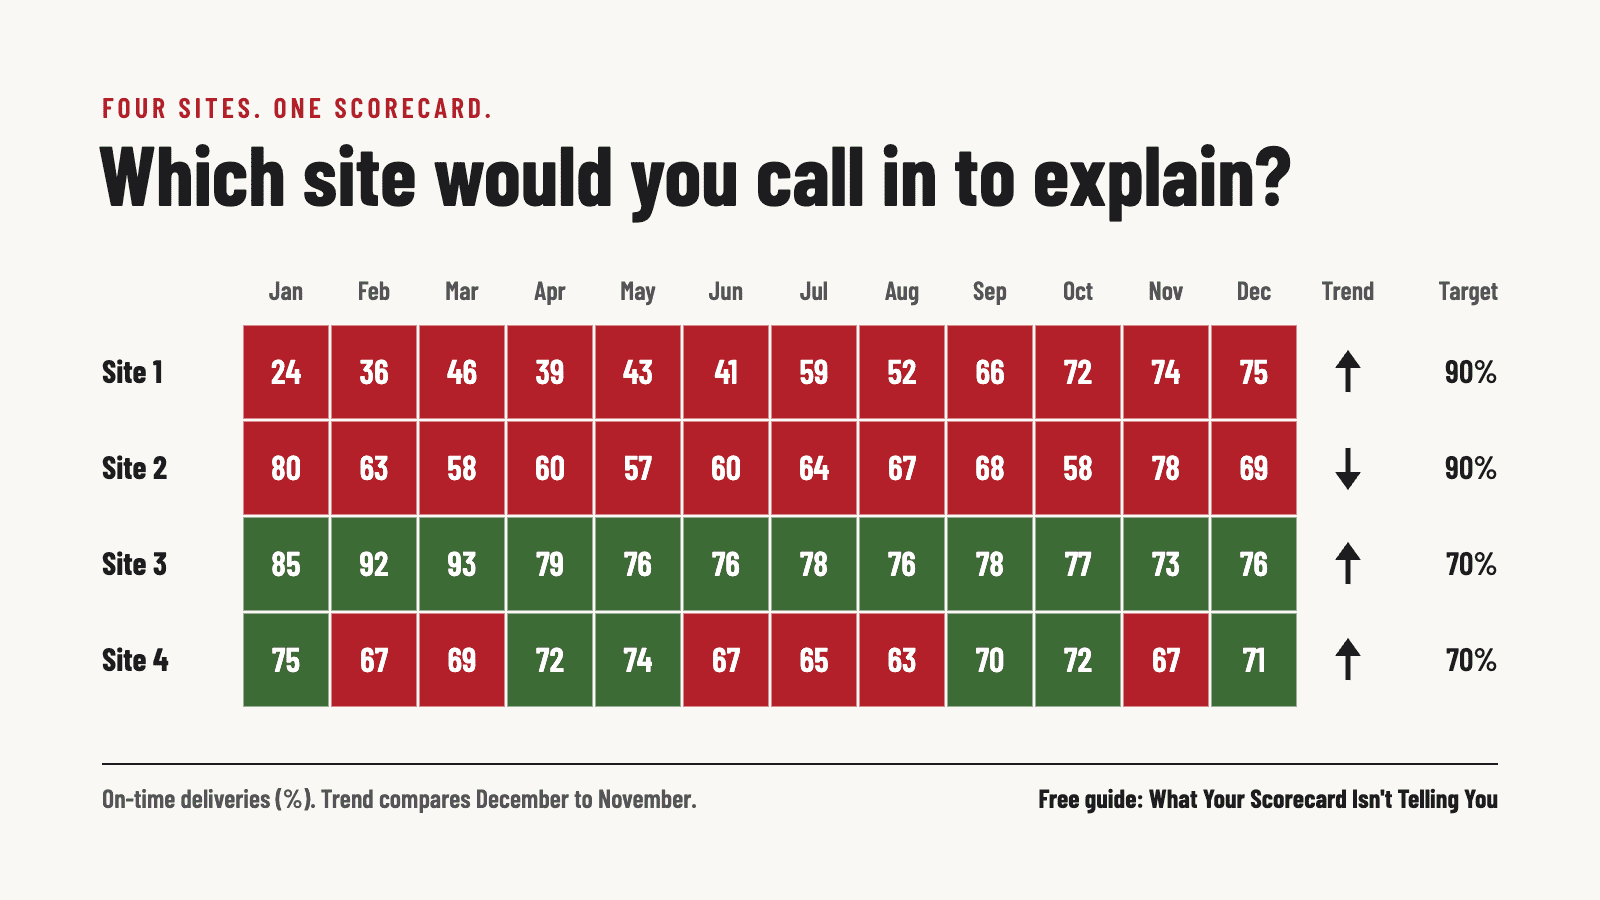
Before you scroll, make a pick. You're the executive responsible for all four sites. Which leader would you praise, and which one would you call in to explain?
When I run this with a room of leaders, they don't agree. Some pick Site 2, because it's red and the arrow points down. Some pick Site 1, because it's furthest from its target. Almost nobody picks Site 3. It's green every month, and its arrow is going up.
The colors send attention in the wrong direction. One site's “problem” is just noise. The site with a real problem never turns red, so nobody asks about it. Looked at the right way, that problem was visible in the spring. On the scorecard, it's still invisible in December.
I walk through all four sites, chart by chart, in a new free guide: What Your Scorecard Isn't Telling You: Why Smart Leaders Look Beyond Red and Green Bowling Charts. Keep your pick in mind and see if you were right.
What a red and green scorecard can and can't tell you
I'm not going to tell you to throw out your scorecard. It answers one question well: did we hit the target this month? The trouble starts when leaders use it to answer two other questions: did anything change, and what should we do about it?
A good smoke detector ignores burnt toast and wakes you up for a real fire. Red and green cells go off for the toast, and sometimes they sleep through the fire.
Most leaders were never taught a better way. Process Behavior Charts rarely show up in MBA programs or leadership development, so it's no character flaw to have never seen one. It does mean the leaders who can read them have an edge in the room. They're the ones who can say, with evidence, which number deserves attention and which one deserves to be left alone.
I wrote Measures of Success for people who want the full method. This guide is 18 pages, written for the executive who runs the operating review, and it doesn't require any statistics background. You also don't have to give up your targets.
What's inside the guide
- What each of the four sites looks like as a Process Behavior Chart, and which leader actually needed the call
- Six ways red and green drive the wrong decisions, including the “two reds in a row” rule
- Why “green means there's nothing to look at” lets real changes slip by, using a daily metric that beat its target 34 days in a row
- Run charts as a first step, then Process Behavior Charts, with the target still visible as a shaded band
- How to introduce the charts without a fight, including a sentence you can borrow for your next meeting
There's also a short section on why we call these grids bowling charts. When I was a kid, we kept score by hand, in pencil, on a sheet that sat on what was basically an overhead projector, so the score showed up on a screen above the lanes. That sheet worked fine for bowling. A game ends after ten frames. Your organization doesn't, and each month isn't a separate game to win or lose.
Send it to whoever runs your operating review
If you've sat in a meeting where someone had to explain a red number that had no special reason behind it, you've seen the cost. A lot of LeanBlog readers see the problem but don't run the meeting. Telling the person who does that their scorecard is wrong rarely goes well. Asking them a question usually goes better.
If it helps, here's a note you can send with the link:
I came across a short free guide on red and green scorecards. It doesn't say to get rid of ours. It suggests adding a few charts alongside it to see which numbers really changed. There's a four-site exercise at the start that I'd be curious to try with the team.
The guide has a section for you, too. The short version: don't ask anyone to give up their scorecard. Add a few charts alongside it for a quarter, and look for a metric that's green but has a signal hiding in it. Showing an executive a problem their scorecard missed usually works better than telling them their red cells are noise.
FREE GUIDE FOR LEADERS
What Your Scorecard Isn't Telling You
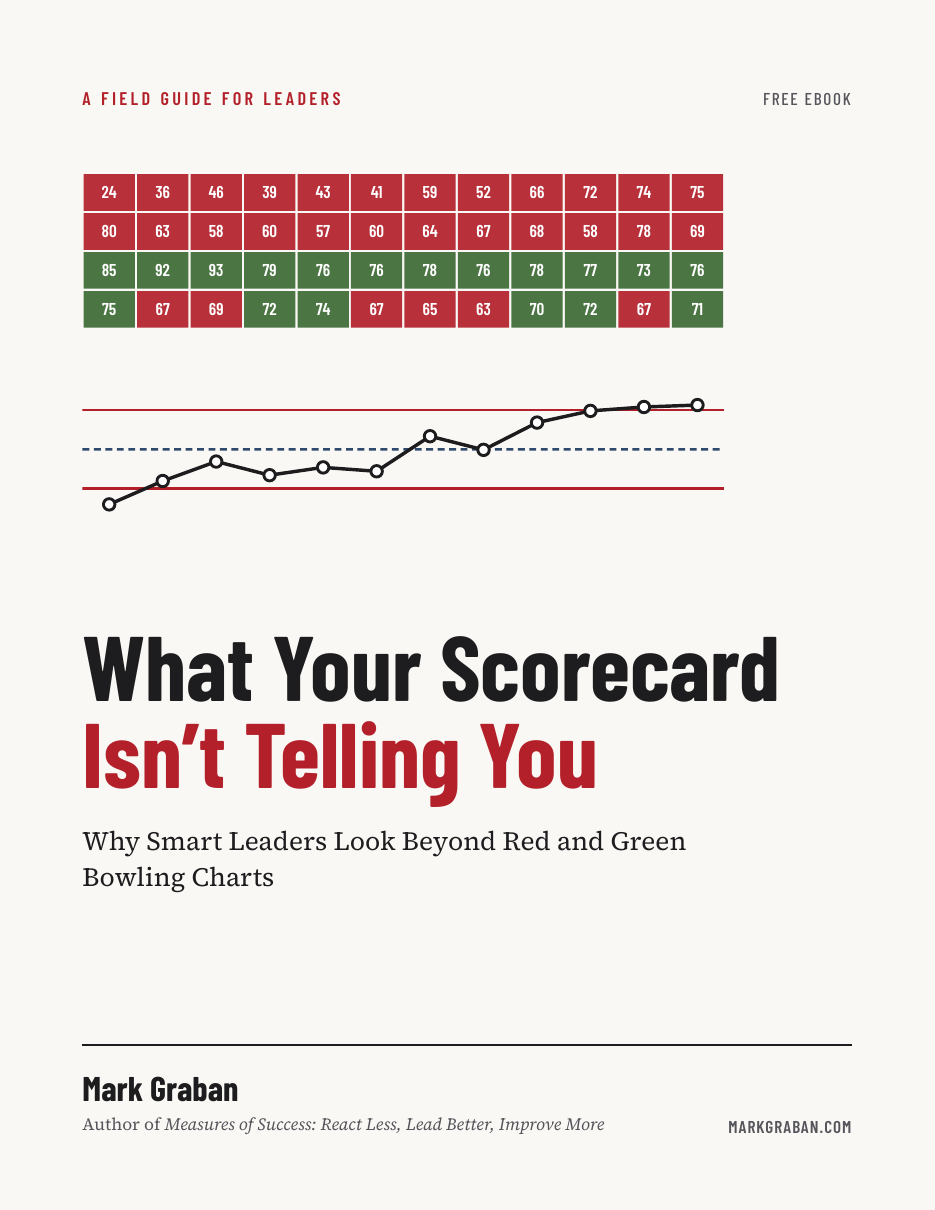
See which of the four sites needed the call, chart by chart, plus a way to add Process Behavior Charts alongside your scorecard without asking anyone to give up their targets. Written for the executive who runs the operating review, so it's an easy one to forward.
18 pages. No statistics background required. The download link appears as soon as you enter your email.
Questions leaders ask about red and green scorecards
What's wrong with a red and green scorecard?
Nothing, for the question it was built to answer: did this month hit the target? The problem is using the colors to decide whether something changed. A red month can be ordinary noise, and a real decline can stay green the whole time.
Do I have to give up our targets?
No. The charts in the guide keep the target visible as a shaded background, green above it and red below it. What changes is that each month stops getting its own verdict.
Do I need statistics training to use these charts?
No. A run chart is just the same numbers drawn as a line. A Process Behavior Chart adds an average and two limits calculated from the data, plus three simple rules for spotting a real change. The guide shows all of it with pictures, not formulas.
Related reading