Tag Don Wheeler

Don Wheeler, Process Behavior Charts, and Better Management Decisions

This archive highlights ideas influenced by Don Wheeler’s work on understanding variation, process behavior charts, and better use of data for management decision-making. These posts explore why traditional scorecards, red-yellow-green dashboards, and snapshot comparisons often mislead leaders—and how statistical thinking can replace overreaction with insight.

Drawing from quality management, Lean thinking, and real-world leadership examples, these articles emphasize separating signal from noise, avoiding blame driven by random variation, and improving systems instead of reacting to every data point. The core theme is simple but challenging: better data doesn’t help unless leaders know how to interpret it. Read more about Process Behavior Charts.

Skip Steward on Deming’s Lessons, Don Wheeler, Process Behavior Charts, and Respect for People
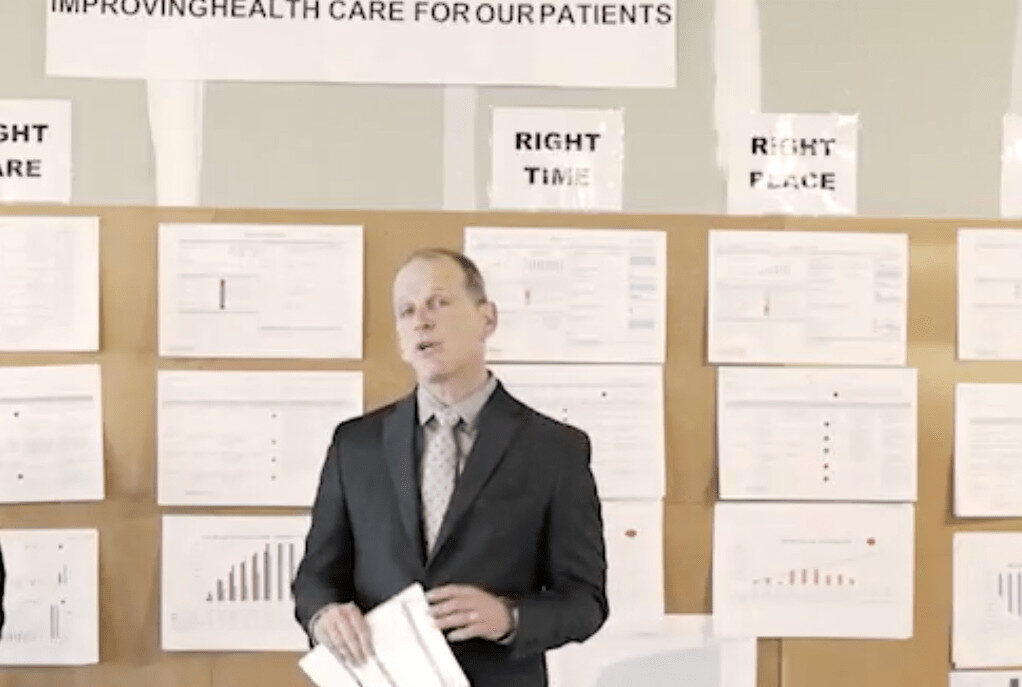
Skip Steward, the Chief Improvement Officer at Baptist Memorial Health Care in Tennessee, was a guest on Episode #314 of the podcast talking about TWI and Toyota Kata in healthcare (he was joined by Brandon Brown).

Today, I've asked Skip to come back and chat 1x1, in Episode #320, about his experience with Don Wheeler, learning from W. Edwards Deming, and more. I hope you enjoy his reflections, our discussions about healthcare, and connections to my book Measures of Success (Skip undoubtedly has a book in him too). 

How Process Behavior Charts Explain Baseball Home Run Outliers

Swinging a baseball bat at dusk against a stadium background with a Lean Blog logo.

If you're not a baseball fan, I apologize for a second baseball-themed post this week. Baseball has a lot of historical time-series data to work with and analyze. If you're not interested in "Process Behavior Charts" or similar methods, I guess I will apologize for this post again too. Next, I'll be apologizing for apologizing.

But, I am at Dr. Wheeler's four-day workshop on "Understanding Statistical Process Control" as I blogged about on Monday.

It's great to learn from Dr. Wheeler in person and I'll be sharing reflections on the class in a later post (and I'm posting a few things on LinkedIn along the way).

In Chapter 1 of Understanding Variation, Dr. Wheeler points out how charts or graphs are far superior to tables or lists of numbers. He uses a baseball example:

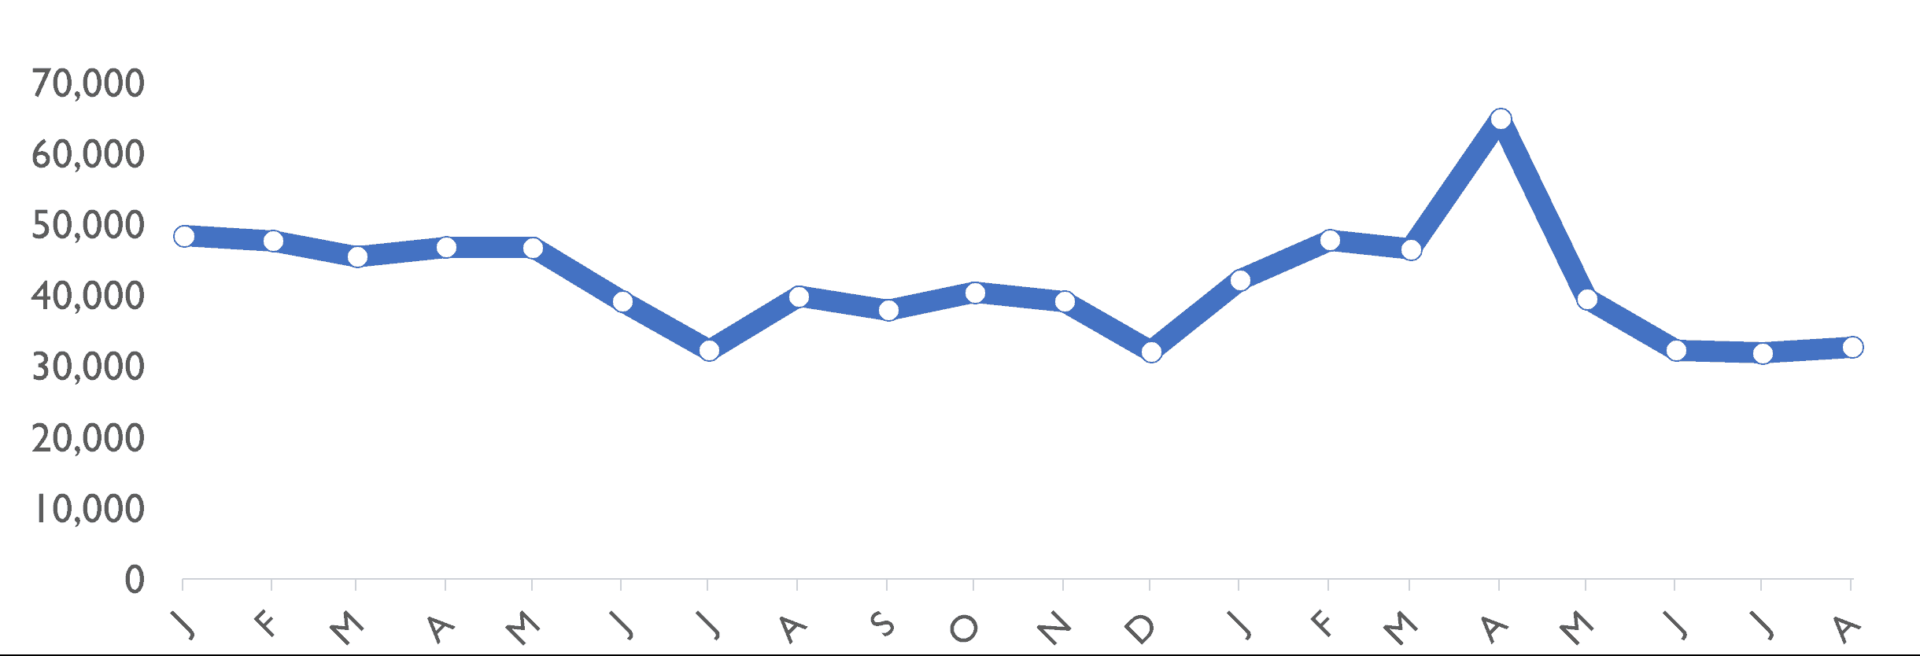
Ratings for “The Oscars” Were Lower in 2018? Should We Ask Why or Look for Longer-Term Trends?

Downward trending line graphic over gold trophy figures representing decline in success or performance.

As I blogged about yesterday, things went well at the Oscars... or, at least, no errors were made in the announcements. But that thing that didn't go well was the TV ratings.

Two Data Points Are Not a Trend
The headlines I saw had a lot of two-data-point comparisons. Headlines sometimes gave the percentage decrease in viewers or how many million fewer viewers there were. Many talked about "record low" but if you're tracking a metric "record low" or "all-time high" doesn't mean there's a "special cause." That "record low" could still be noise in the system.

Two Data Points Don’t Make a Trend: Why Headlines Mislead Us

Gun pointed downward, hidden behind a tape measure, with a large grey downward arrow overlay.

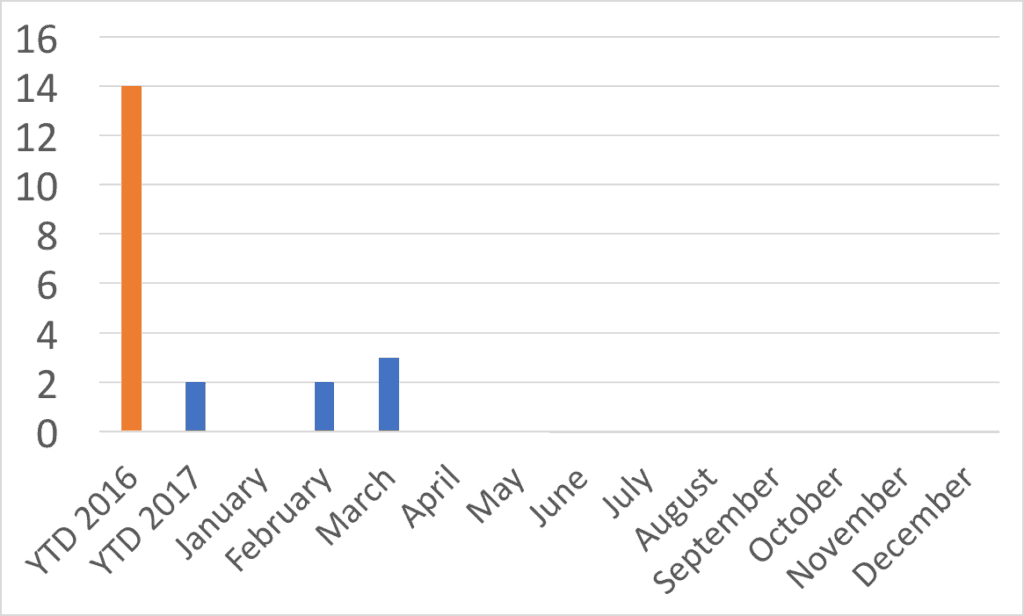
When looking at data, whether it's the number of homicides in San Antonio or some of our workplace metrics, it's tempting to overreact to a "headline" that says a measure went down in 2017 compared to 2016. But do two data points really help us understand what the real trend is? This blog post explores an approach we can use to make better decisions about our data.

Not All Improvement Ideas Require “Projects”

In this post, I share some thoughts and build upon one of the presentations at last week's Lean Healthcare Transformation Summit, where, Tim Pehrson, a regional CEO for Intermountain Healthcare, talked about how they piloted a continuous improvement process in one region... and how they're now spreading it throughout the system. This leads to confusion, in online discussion, about terms like projects, suggestions, ideas, and such...

An AI that won't just give you the answer. That's what makes it useful.Free Demo -- Learn More
+ +