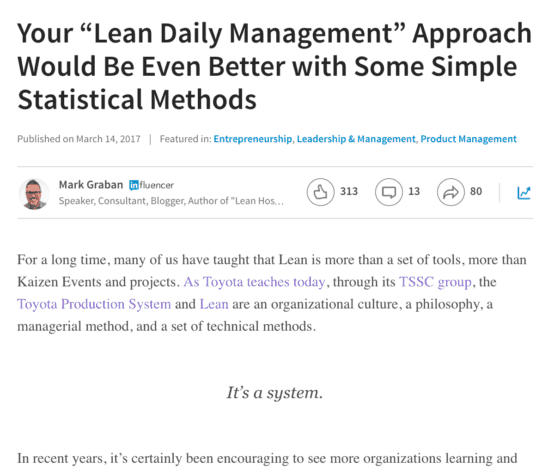
Here is an article that I wrote and published on LinkedIn on Tuesday on the topic of managing metrics in a better, less wasteful, less frustrating, and more productive manner.
Click here or on the image below to read it. I hope you'll comment below or on LinkedIn.
Here's an “audiobook” style video of the post, as I've slightly updated it in August 2018:
I've written about these concepts a lot on this blog… but I hope you enjoy it and find it to be thought provoking.
Monday, I taught a workshop on these methods at the Lean Healthcare Transformation Summit in Brussels. I'll be teaching these methods again in:
- a workshop sponsored by Catalysis in Seattle this May
- a pre-summit workshop at the Lean Healthcare Transformation Summit in Palm Springs this June.
I hope you'll join me. I hope you'll buy Understanding Variation and, more importantly, I hope you'll put these methods into use.
Here are some related posts on this topic:
Meeting A Professional Hero: Donald J. Wheeler, PhD, of “Understanding Variation”
Better Metrics & “Understanding Variation” – An Important Topic for Healthcare
Why Red-Green Charts in Management are a Rear-View Mirror Approach
What's Demoralizing? The Colors on a Chart or Not Improving the System?
Data Without Context Isn't Very Helpful; Don't Overreact to Each Up & Down
I hope these are helpful.
Please scroll down (or click) to post a comment. Connect with me on LinkedIn.
Let’s work together to build a culture of continuous improvement and psychological safety. If you're a leader looking to create lasting change—not just projects—I help organizations:
- Engage people at all levels in sustainable improvement
- Shift from fear of mistakes to learning from them
- Apply Lean thinking in practical, people-centered ways
Interested in coaching or a keynote talk? Let’s start a conversation.


