


tl;dr: The article critiques the traditional use of red-green charts in management, likening it to driving by looking only at the rear-view mirror. It advocates for a more forward-thinking approach that incorporates context and trends, enabling proactive decision-making rather than reactionary measures based on outdated or incomplete data.
There's an expression that was used by Dr. W. Edwards Deming, and also by Dr. Don Wheeler, that says managing through metrics (and comparisons to targets) is like driving by looking in the rear-view mirror.
Taking action on the basis of results without theory of knowledge, without theory of variation, without knowledge about a system. Anything goes wrong, do something about it, overreacting; acting without knowledge, the effect is to make things worse. With the best of intentions and best efforts, managing by results is, in effect, exactly the same, as Dr. Myron Tribus put it, while driving your automobile, keeping your eye on the rear view mirror, what would happen? And that's what management by results is, keeping your eye on results.
Wheeler used this imagery and quoted Tribus as well in his great (GREAT!) book Understanding Variation (see my thoughts on how influential it has been for me):
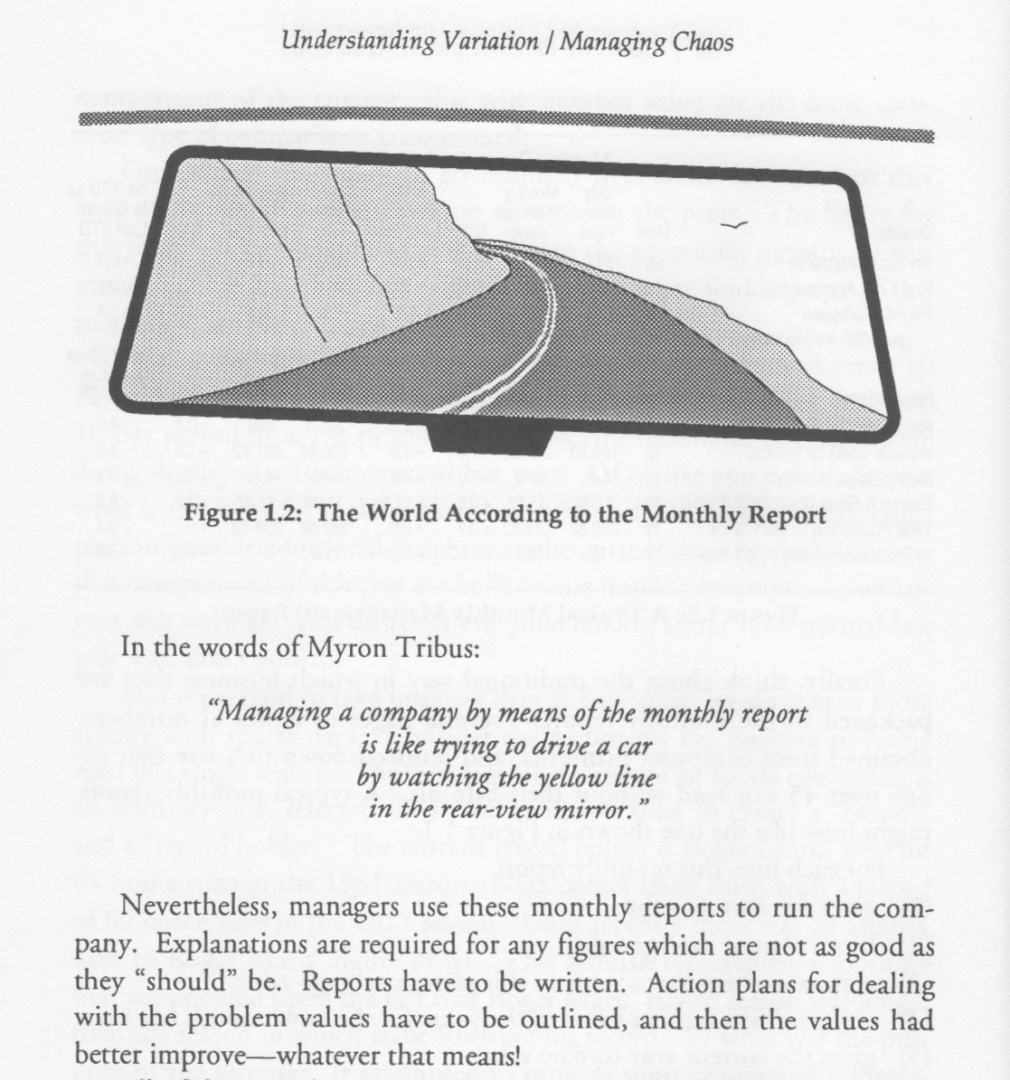
Monthly reports, weekly reports, daily metrics — they can all drive the same dysfunctions if they are managed using simplistic “red/green” reporting.
Let's look at a scenario where we have a weekly “satisfaction” score (could be patients, employees, customers… ignore where the data comes from – it's just there).
Management might set a target of 80. What is this based on?
- It could be arbitrary (which is bad)
- It could be based on a benchmark or an industry percentile (which might not be helpful)
- It could be based on last year's number but a little better (let's say last year's average was 78)
Managing by Red/Green Comparisons
How do people manage with these comparisons? Let's look at a very common and realistic scenario that would play out over time.
In this red/green approach, we compare each data point to the target. Again, this target might be very arbitrary.
This weekly score might be part of a “dashboard” that has many other measures on it. It might have too many different measures, which means the car “dashboard” analogy quickly breaks down, but that's another blog post.
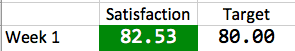
The score is higher than our target. Management congratulations the team. “Way to go!” They might write that on the dashboard. Management pats themselves on the back and says, “Yeaaaaaa, we are skilled managers. We set a target and that inspired people. Hurray!”
Life goes on.
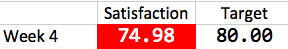
The next week, the dashboard comes in:
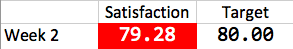
Oh no! Below the target. Management says, “You all have to try harder. We know you can get an 82. Look, you did it last week.” The managers say privately, “Ah, see, people slack off when you give them too much praise. We'll remember that.”
Life goes on.
The next week, the dashboard looks like this:
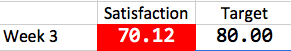
Management says, “Oh no…. we were too hard on them last week.” But they still rally the team to say, “You have to do better! Give us your improvement ideas!”
Life goes on. No improvement ideas come forward (which is management's fault, if anybody's, by the way).
The week weeks come in:
Still red.

Still. Red.
What gives? Last year, they averaged 78. We set a goal at 80. Now, they can't even be above average!! The threats or the promises of rewards might get stronger.
Life goes on. Management has not asked for improvement ideas because “we already did that.”

Still red.
Red again. Management says, “We need to put that supervisor on a performance improvement plan, because they clearly aren't performing well.”
Fear & Pleasing the Boss
It's important to take a time out to think about what happens when people are pressured to hit a target.
Brian Joiner wrote, in his outstanding book Fourth Generation Management: The New Business Consciousness, that there are three things that can happen when you have a quota or a target imposed upon people:
- Distort the system
- Distort the numbers
- Improve the system
See examples on my blog about “gaming the numbers.”
Without a method for improvement, pressure hit the target and to be “green” will drive people to distort the system or the numbers. It be negative pressure of “hit the target or else!” or positive pressure of “hit the target and we'll give you a reward.” Either way, it can get very dysfunctional very quickly.
Managers might get creative about making sure certain patients or staff don't get the survey to complete. Or, they might do things that artificially encourage people to give good rankings. I call that “begging for scores” instead of improving the scores. Our focus needs to be on improvement, not just the score. We need to actually improve the system, not distort it.
Back to the Red/Green Comparisons
Life goes on.
GREEN! Glorious green!
Management tells the team, “We knew you could do it! It just too more attention and hard work!” They say to themselves, privately, “Good, that PIP got her attention. Remember that.”
Life goes on.
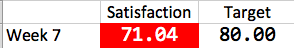
The next week's scoreboard goes up:
RED. Blasted red. “We thought things were getting better!”
OK, this is exhausting. And for good reason.
Driving this way is like driving with blinders on. You're looking at each data point in ISOLATION. You're simplistically comparing it to the Target in a “good” or “bad” way. Wheeler calls this a “binary world view” – good or bad. Life is more complicated than that.
Data Need Context – Run Charts Help!
Instead of just looking at a data point and the target, a simple “run chart” can help. As an aside, this should be a LINE chart, not a bar/column chart, for a number of reasons).
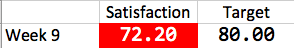
What is the run chart of these nine weeks of data?
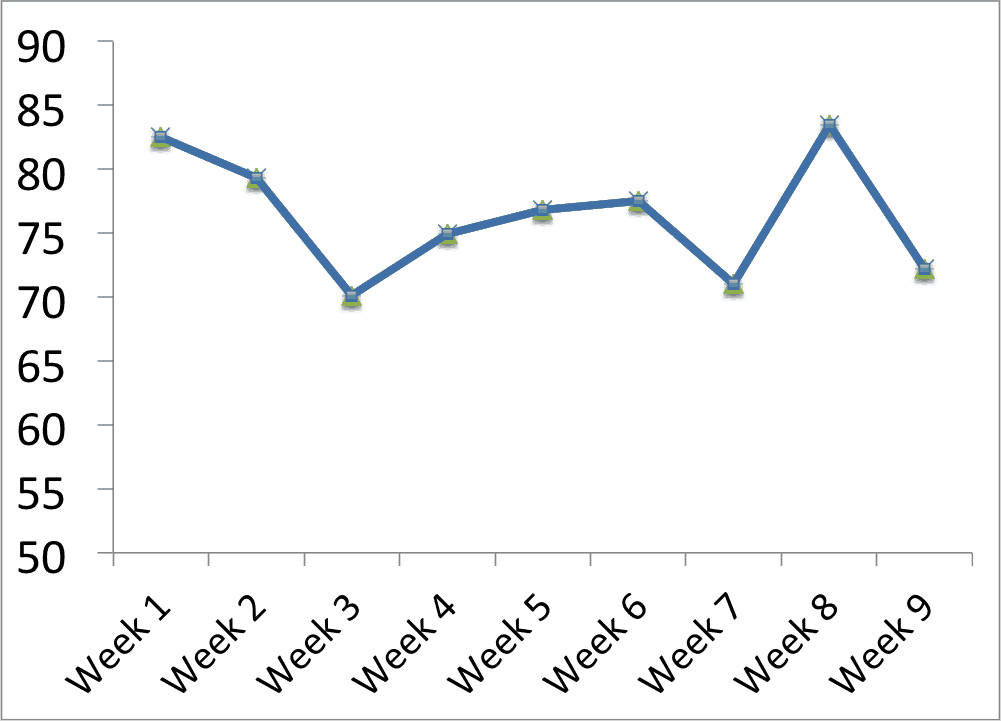
Hmmm, now we can look for trends. There's ups and downs in the data. There's what looks like “noise.” Is there any signal?
Note I didn't draw the target line on the graph. That target might be pretty arbitrary. We already know that we're generally not meeting the target, for what that's worth.
What's more helpful is putting the “mean” or average on the chart.
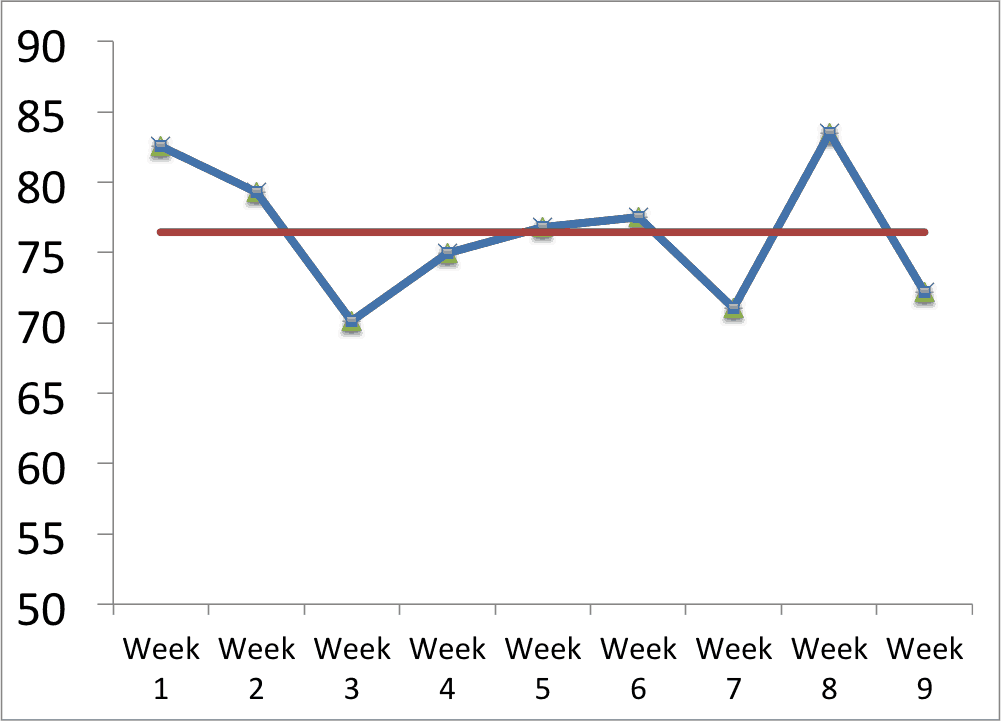
You might not be surprised that three data points are above the mean, three are right about on it, and three are below the mean.
The mean for those first nine data points is 76.43. Slightly below last year's average.
Most managers would ask, “How does the data compare to the target?”
Deming and Wheeler would ask us to ask, “Does the chart suggest that the process is in control?”
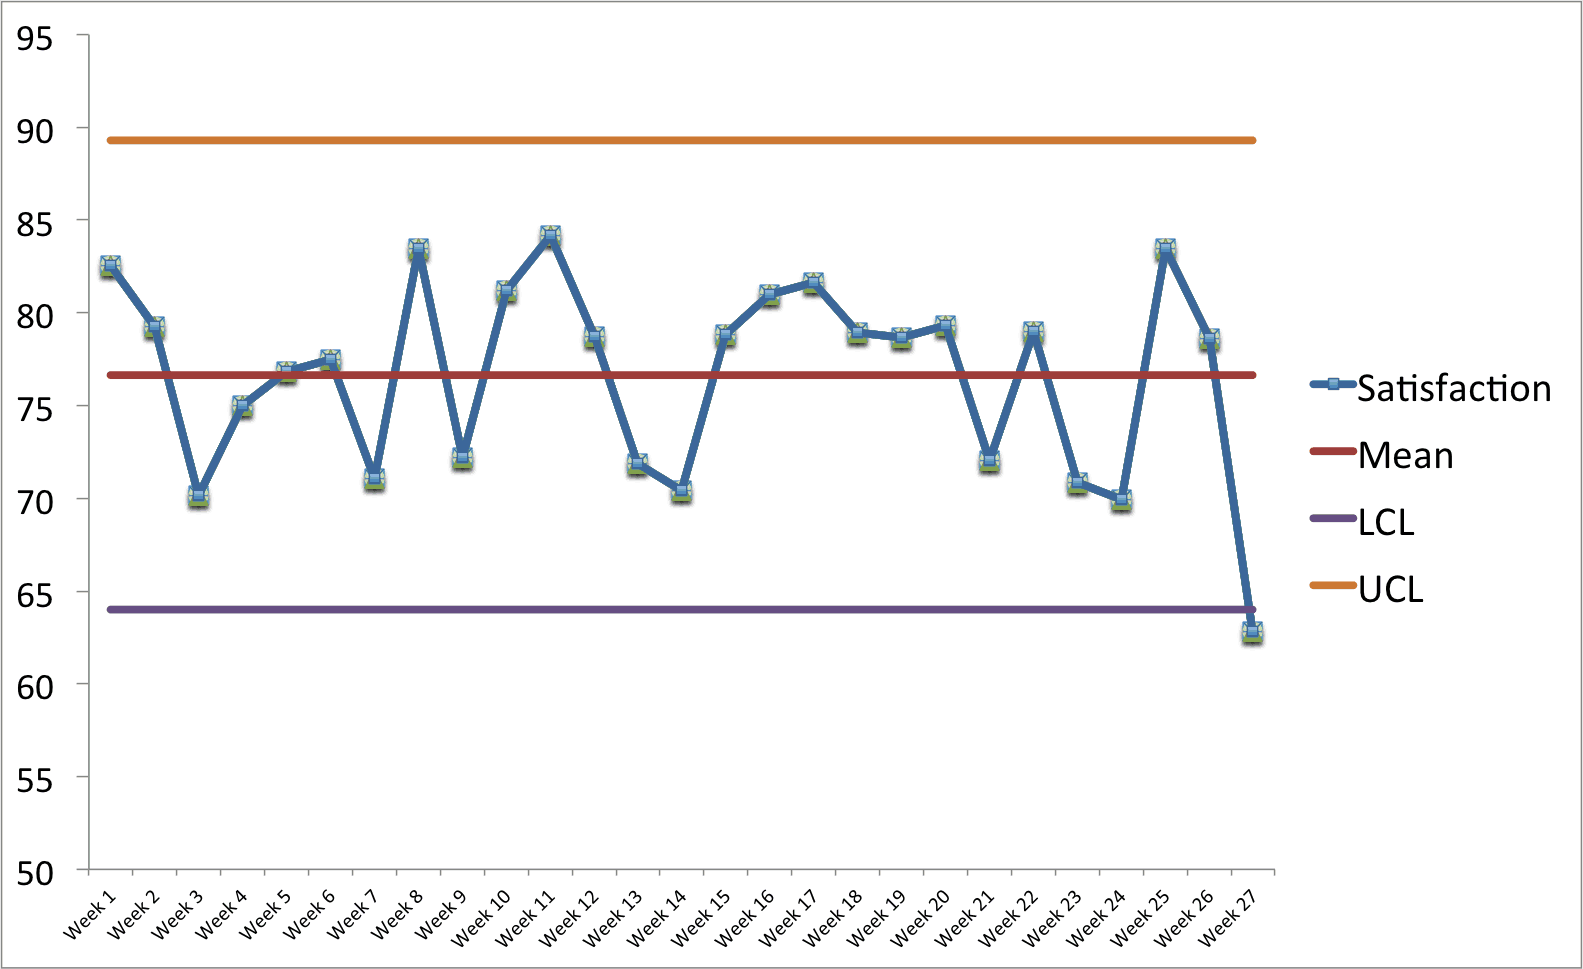
To know that, we create a “control chart” as a “Statistical Process Control” (SPC) method. Since you generally want to use 20 data points to create the “control limits” on the chart, I've moved time forward through 20 weeks of results (the mean is now 77.5).
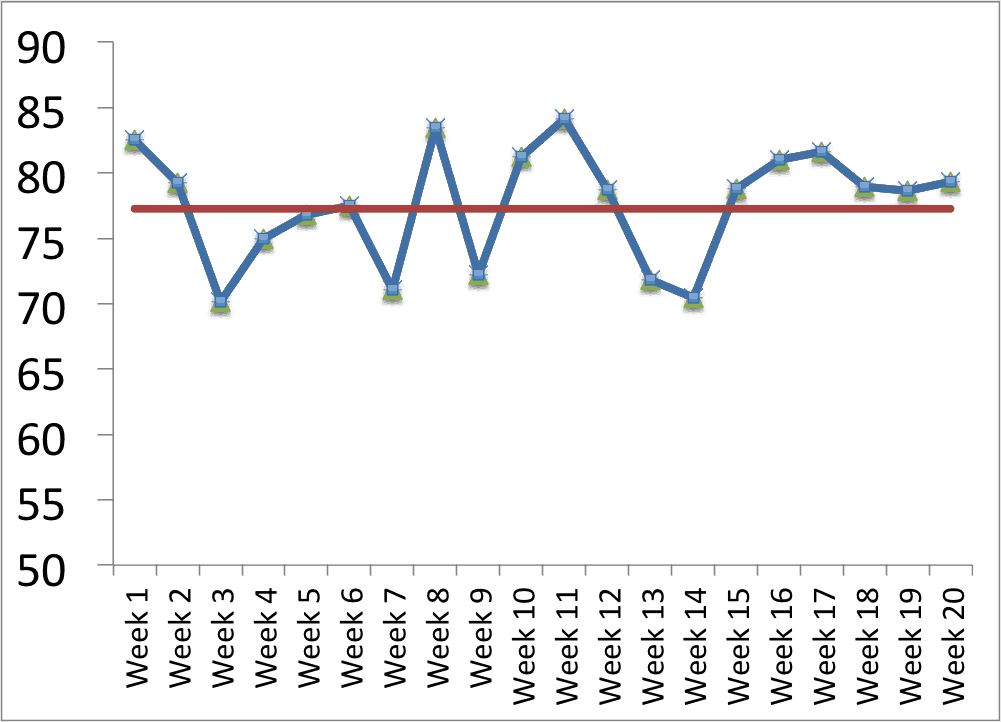
The red/green minded manager might notice that only six of the 20 points are above the target. Slackers!
Here is what the control chart looks like, with the “3 sigma” Upper Control Limit (UCL) and Lower Control Limit (LCL) – sparing the details of how those limits are calculated.
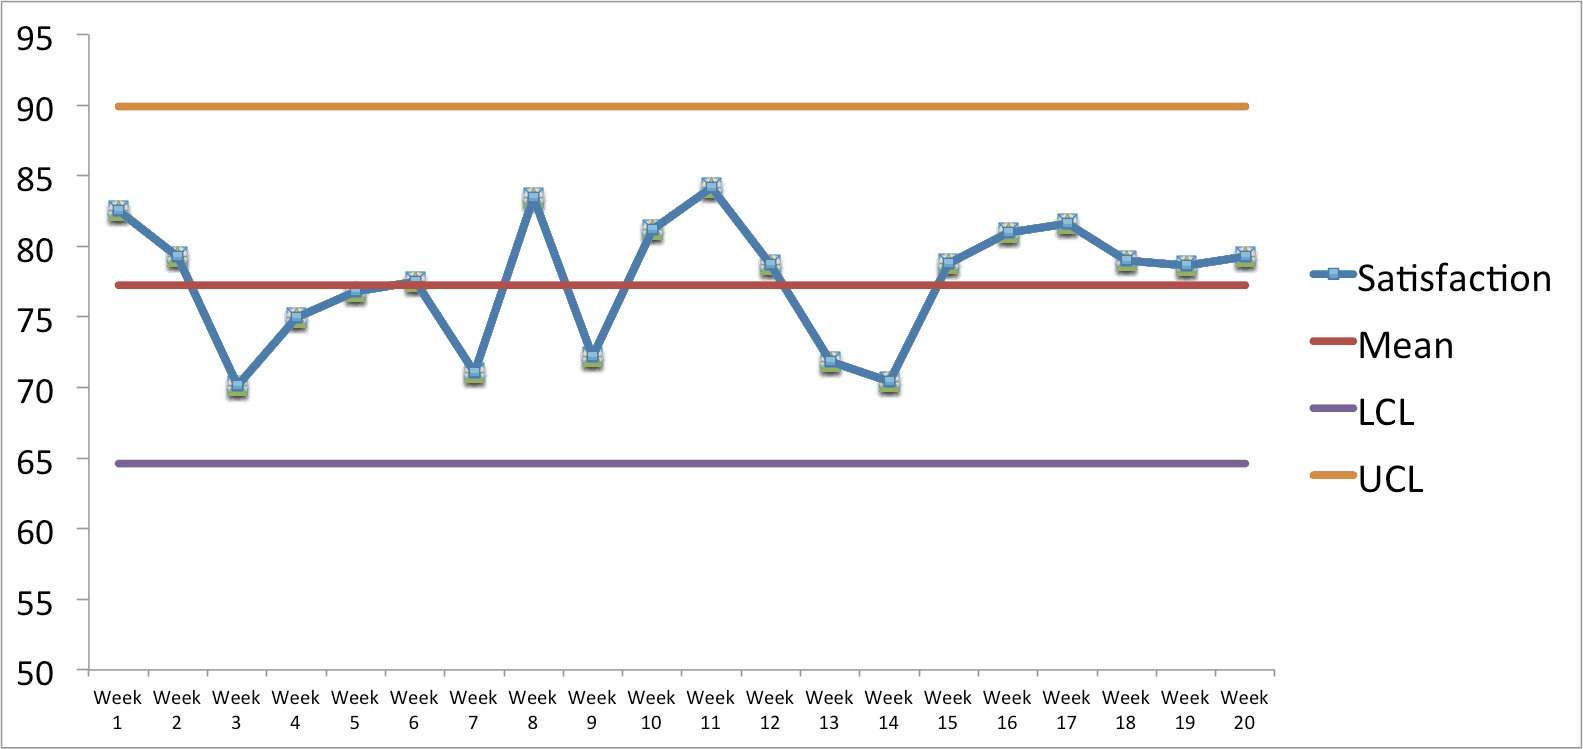
This is what we'd call a stable system – it's “in control.”
In fact, the data for the control chart was created by Excel's random number generator, using a normal distribution with an average of 78.
All of those data points were created by the same system. The variation from point to point is statistical noise in the system. It's statistically possible to have six data points above the mean and still have it be part of the same system. Red/Green managers might think there is improvement (even though only weeks 16 and 17 were “green.” It's more than likely that Week 21 would be below average.
You might wonder what the relationship is between a random number generator and a real workplace would be. Well, if we have a stable workplace system – the same staff, the same procedures, the same workloads, the same physical space, etc. then we'd expect similar outcomes each week in the satisfaction score. Some weeks will be higher than others. Some will be above average and below average. That's just noise in the data. We shouldn't overreact to each data point and SPC shows us how to avoid doing so.
Being “in control” allows us to predict the following with pretty good certainty:
- Any given week's satisfaction score is going to be between 65 and 90.
- The current system is incapable of delivering scores of 80 or above each week.
Manage the System, Not Each Data Point
Deming and Wheeler teach us to focus on the process that generates these stable results. If we want to increase satisfaction scores, we have to reduce the sources of “common cause” variation. What are the things that patients or staff frequently complain about? If we eliminate some of those problems, we'll increase the average score and probably reduce variation in the score.
Without improvement, the control chart might continue like this, where everything is, of course, inside those control limits.
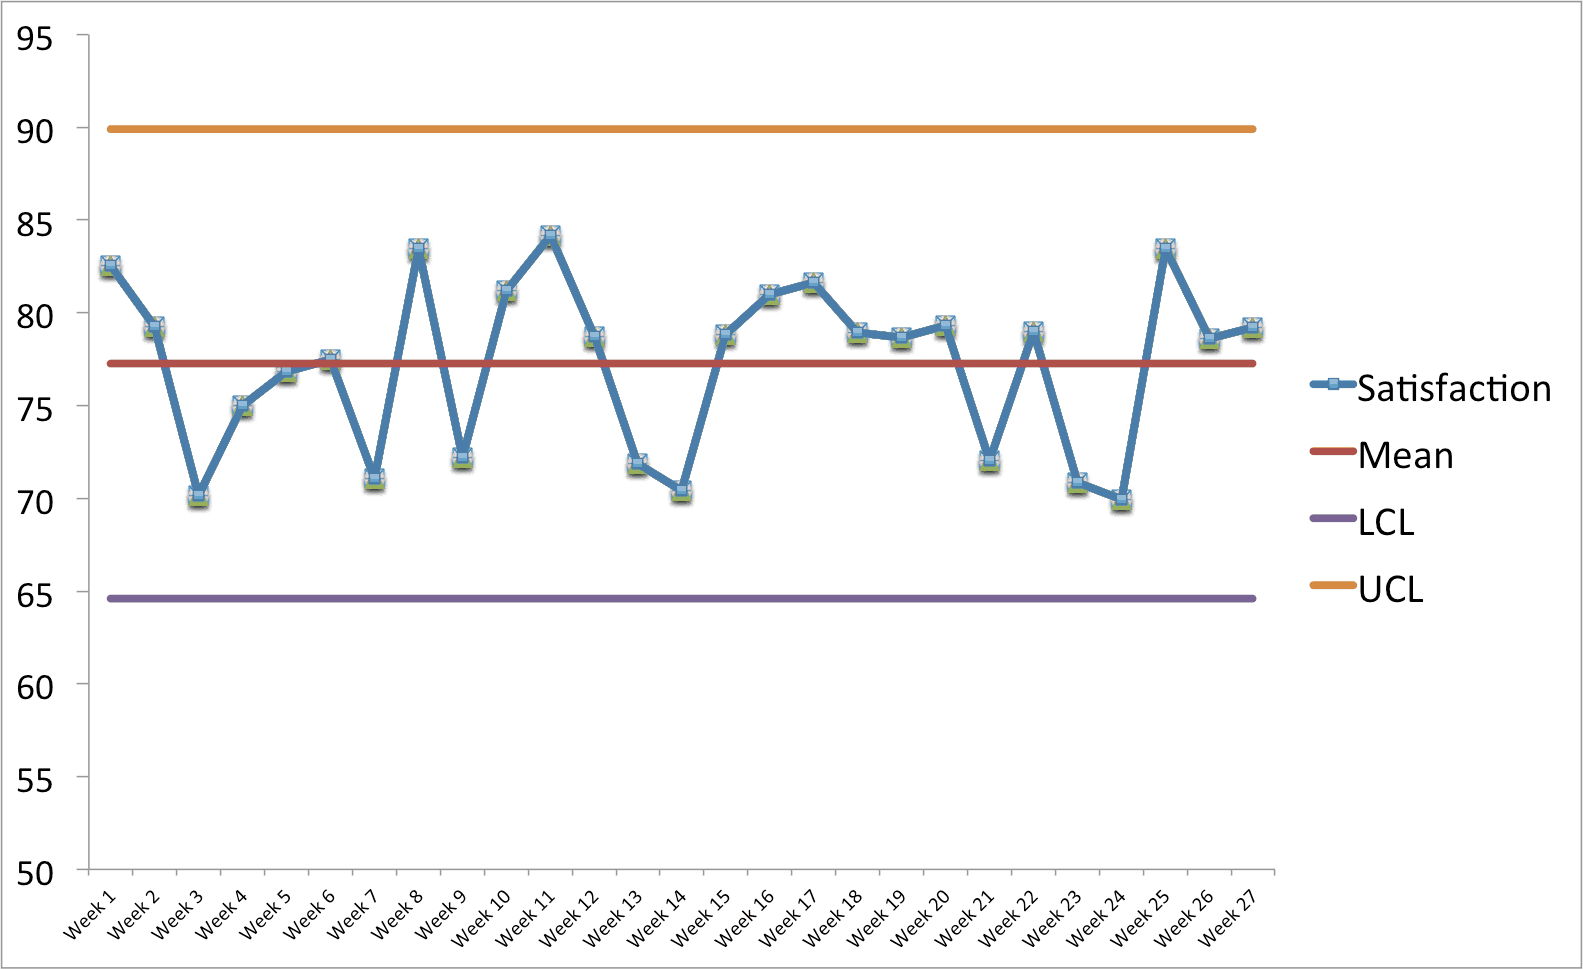
If we have a single week where the score is below 65, we should ask “What happened?” By this, we can finally ask “What happened that week? What was different? What went wrong?” Rather than blaming individuals, we need to look at the system. Those questions need to be followed up with “What can we do to prevent that problem from occurring again?”
Likewise, if we ever had a single week with a score of 90 or greater, we should ask, “What happened?” Just as it's statistically unlikely to have a random score below 65, it's unlikely to have a score above 90 unless something changed. Maybe staff were experimenting with some new approaches. We want to make sure those become the new standard practice and, hopefully, see sustained improvement.
As Regis Philbin (or Dana Carvey impersonating him) might say — this chart “is out of control!” There is most likely a “special cause” to be found.
Asking people to explain each up and down in a stable process is a waste of time. There's no special cause occurring any particularly week in a stable system. It's all noise, it's “common cause” variation. We can't ask, “What happened last week?” We instead need to ask, “What's happening each week that leads our performance to be lower than we want it to be?”
As we look at a control chart over time, there are different “Western Electric Rules” that tell us when the system is no longer stable and in control. One of those rules is to look for nine consecutive points above the mean. That's a statistically significant signal that the system has changed. Not six points in a row above the mean (remember, that can occur randomly). It's unlikely to have nine consecutive points above the line occur through chance.
Here's what a process shift like that looks like:
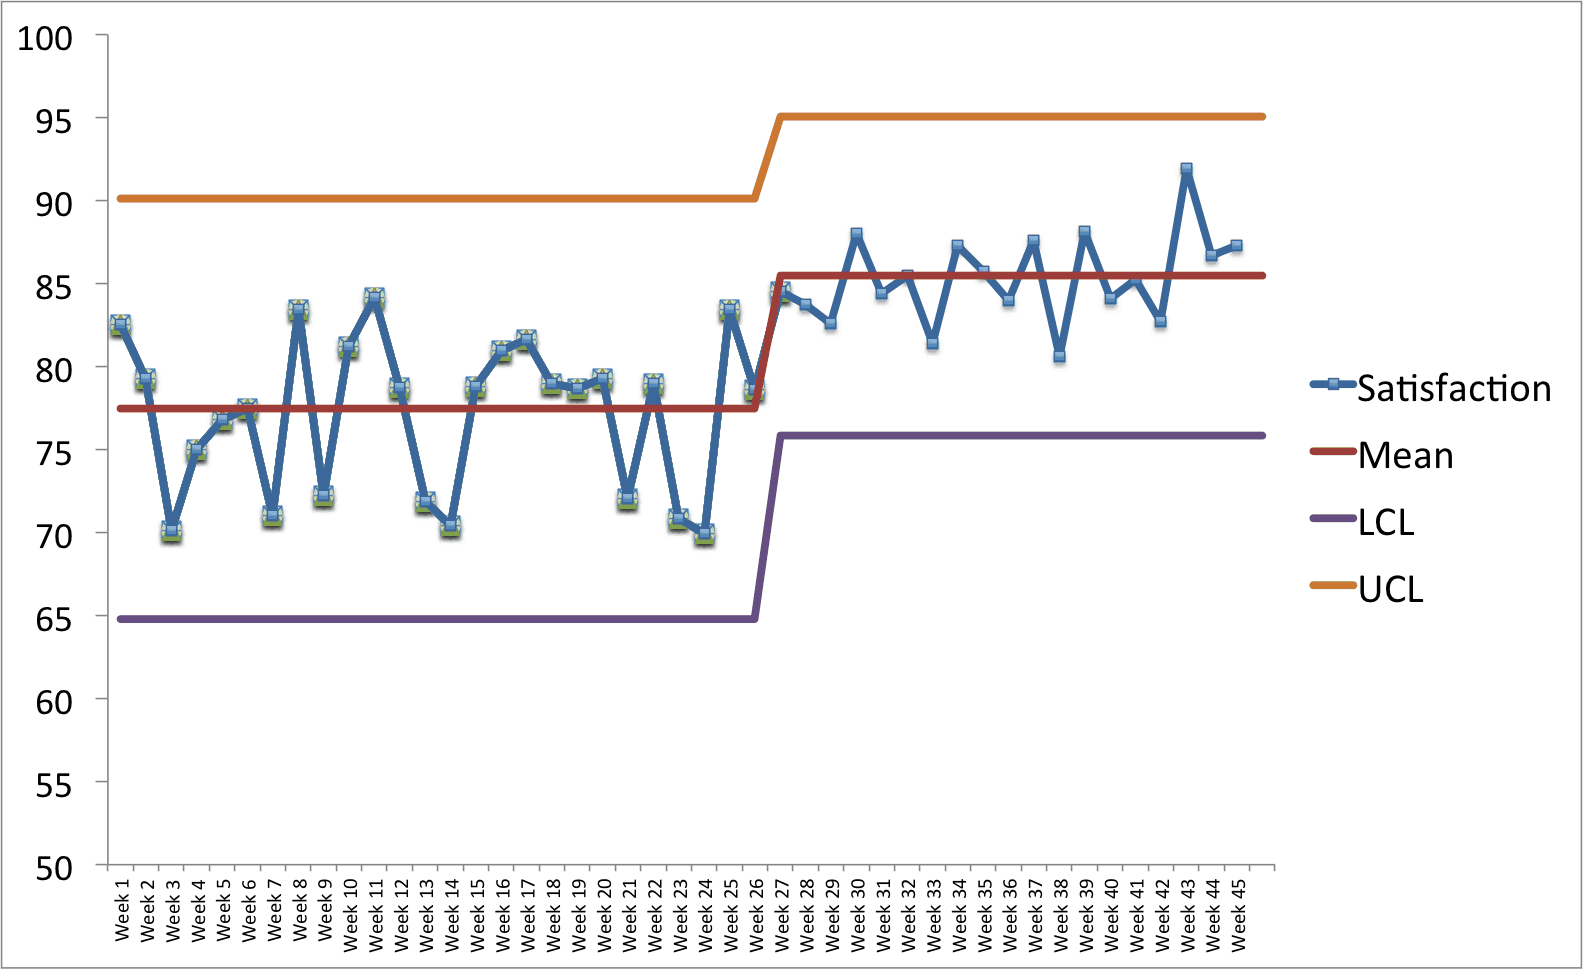
That's a stable system at a new level of performance. The mean is higher and there's slightly less variation (I reduced the standard deviation in the random number generator from 4 to 3.5).
The lower control limit of 75 tells us we might occasionally have a week under 80. But, again, who cares about an arbitrary target? What matters is the improvement. That's what should be rewarded, not hitting some target.
What Are Your Thoughts?
Have you used methods like this in your organization? Can you relate to the problems caused by red/green comparisons and being managed by pressure? Please leave a comment and share your story. Would you like to learn more about this? I've been talking with Mike Stoecklein about co-authoring an eBook on this topic that would include how to examples for creating control charts and using them.
Please scroll down (or click) to post a comment. Connect with me on LinkedIn.
Let’s work together to build a culture of continuous improvement and psychological safety. If you're a leader looking to create lasting change—not just projects—I help organizations:
- Engage people at all levels in sustainable improvement
- Shift from fear of mistakes to learning from them
- Apply Lean thinking in practical, people-centered ways
Interested in coaching or a keynote talk? Let’s start a conversation.


I’ve read Donald Wheeler’s book a few months ago. I finally understood why the numbers change every month without doing anything special or different.
There’s only one catch. Since reading it, I’m having trouble with accepting my managers/bosses visions of metrics. They didn’t read “Understanding variation” and are convinced you have to react when a score changes a lot month-to-month. In practice this means action plans and corrective actions which are not necessary or even disruptive.
I understand, Niels. That’s why I’ve said, only half jokingly, that reading Deming was both the best thing and the worst thing I’ve ever done. It’s easier to tolerate a red/green world when you don’t understand the statistics and common cause variation vs special cause variation.
We have to try to educate our leaders. The red bead experiment is a good way to illustrate the principles.
That’s why Mike and I want to work on a book… not one that scolds people, but hopefully helps them see a better way.
OMG! Is Mark Graban going Six Sigma on us? LOL.
Seriously, great post. It should be required reading for any leader.
I’m glad you liked the post. Thanks!
To the OMG…. LOL, not really. SPC isn’t exclusively a Six Sigma practice. We used SPC (albeit not well, for a number of managerial reasons) at GM when we were adopting/copying Lean in the mid 90s. Six Sigma had nothing to do with it then… or now.
I’m still not a big fan of the pomp and circumstance that surrounds Six Sigma, but you can’t argue with math and statistics!
I remember reading somewhere that Toyota must be using SPC considering the tight tolerances they are holding on machine tools that are almost always internally built and sometime fairly crude compared to what many others in the same industry are doing.
Very informative post. I just left a meeting where much performance data was presented with control limits and the leadership team understood not to question data points not out of limits. On the other hand, this organization is almost wholly reliant on control charts where the most recent data is almost always a month or more back in time. No one in leadership role is doing real-time observation checks. So, isn’t rely on control charts that are weeks old still driving through the rear-view mirror?
I’m glad to hear there are people using SPC and control charts.
Toyota certainly uses control charts. I was at the Toyota San Antonio plant and a tour guest asked if they use Six Sigma. The Toyota guide (a front-line associate and team member) said no. But, they do use the “7 basic QI tools,” which includes pareto charts and SPC.
That said, there were plant metrics posted out in the factory floor (such as employee safety) as run charts, but I didn’t see evidence of any formal control limits, etc.
Re: monthly control charts… that probably makes sense at an executive level, but I’d hope there are more timely metrics in the gemba (daily or weekly charts). Daily SPC charts can be drawn by hand (this was the case at GM 20 years ago and in some hospitals today). I’ve seen daily SPC charts done electronically in Excel when there is a disciplined process around creating and posting those daily (and reviewing them). Monthly charts are rear-view… but having a stable, in-control process gives us some confidence of what is likely to happen in the future if the process remains stable.
There should be a combination of charts and real-time visual controls. Having too many people sitting in the waiting room is an obvious visual indicator… the key is responding to the visual indicator that flow is bad (assuming there’s a “special cause” number of people in the waiting room and that a mass of people isn’t normal and expected).
People often mistakenly label monthly charts as “visual management.” Yeah, posting a chart on the wall is visible and can be helpful, Better yet is real-time visual management where decisions are made and plans are put in place based on that real-time status. We have to, I guess, be careful of tampering… but that’s a different discussion, I guess.
Finally, I’d disagree that management should never talk about data points inside of control limits. We might have a stable process, but if it’s not performing to needs, management needs to address it. Reducing common cause variation is different than reacting to a special cause point.
If the need is a door-to-balloon time of 60 minutes and the average is 90 minutes… it’s stable and in control, but it still needs improving. It’s just a more complicated discussion than asking “what happened?” on a day when the number is 92 and not asking anything when the number is 87.
Hi Mark,
I’m used to seeing (and promoting myself as well with current clients) hourly, daily, etc. charts that also involve the use of some sort of control limits. Sometimes I’ve used or see companies use the true control limits, but I’ve also seen companies use more intuitive control limits based upon their historical evaluation of “exceptional variation”.
For me the use of control charts should help teams to identify problems that they can work on (mostly I want teams to work on assignable cause variation) and those that management should work on (common cause variation – the average level).
At one of the companies I’ve worked for before I worked as a consultant we used differnt control “levels” whereby a deviation beyond a certain level would lead to a corresponding standard reaction (e.g., >10% deviation, inform your team lead, >20% inform your supervisor, >30% stop the line and involve the manager).
Coincidentally I have also written about this theme in a blog poast from end of last year (you can find it here and would welcome your and other’s feedback: http://www.dumontis.com/en/blog/climatechangeSPC).
By the way, I do think there’s typically more attention in Six Sigma for SPC than you’ll mostly see in Lean groups or discussions (although for me it has always been part Lean). In that sense I don’t mind “borrowing” from what many maybe will see as a Six Sigma element.
Last remark, I have also found it very interesting to read Shingo’s thinking on SPC in his book on zero defects, where he writes it took him decades to get away from the SPC spell and truly move to zero defects. What are your thoughts on that?
Best regards,
Rob
(PS: good luck in the Netherelands!)
Good discussion on this topic Mark.
Some definitions and clarifications I might add:
* Dr. Deming talked about “understanding and managing variation”, others have (unfortunately) placed things into containers. One example “SPC” (statistical process control). Dr. Deming warned about this as in both “out of the crisis” and “the new economics”. He was not advocating the proliferation of control charts (he predicted that doing so will be short-lived, and then management will not only get rid of the charts, but the people who produced them).
* Understanding variation means to know how to interpret and act on data when you have it (distinguish between common causes and special causes) and also using the same principles when you don’t have data (do the results, behaviors come from the individual, the system, or the interaction between the individual and the system?) This is where the most important applications are – in the management of people.
* Just because a process (or system) produces only random variation does not mean nothing can or should be done about it. Maybe this is what Rob was referring to with the “SPC spell”. Removing special cause variation is only the first step, the next step is continual improvement of the system. It could be possible to work toward zero (seek perfection). Dr. Deming’s demonstration of the funnel illustrates this. Some ideas will be simple (move the funnel closer to the target). Some ideas will be more costly. Some might be prohibitive. He also talked about the importance of “loss functions” to think about
working toward perfection.
* It could be that the “operational definitions” of what action “red” or “green” signals is needed. In the typical reaction (which mark explains), “red” means “explain and take action”. And green means “where hitting the goal” (we have arrived, and no further action is needed. If the process is stable and can be improved and will produce better results for the customer, then the red/green code means nothing. Color coding could be a trap that keeps us in the bi-modal thinking of “we are OK” or “we are in trouble”. It could be preventing us from the mindset of “continual improvement”.
Thanks for the great additions.
I had somebody at a state hospital meeting take issue with me for talking about working toward zero defects. He said (and I’ve read this) that Dr. Deming said that was a ridiculous concept and just a slogan.
Well, Deming said “by what method?” and I think Lean/TPS gives us a method… poka yoke or error proofing. We’re not blaming the person or just putting pressure on them (“zero defects” could be just an empty slogan, unfortunately). I can’t imagine how Dr. Deming would have disagreed with error proofing.
People misquote Dr. Deming all the time. It leads to a lot of misunderstanding. When he chided the “zero defects” approach, he was pointing out that a goal (zero) without a method is nothing more than an exhortation.
The method makes the difference.
What a great topic and a great post!
SPC will never be a best case, but it is a great short term tool to help understand the system. Ideally all processes would have error proofing that would make SPC pointless, but we will probably never get to a place where all processes are “error proofed”.
Mike I love your comments about Red and Green hiding areas for improvement and preventing continuous improvement. I think that is so true that when we use red/green indicators for our only call to action we will miss many opportunities. I have had multiple managers say to not work on the green areas even if those are the areas with the most opportunity for improvement. Not working on the areas with the most opportunities for the sake of a red/green metric should raise lots of questions. If the red/green are perfectly tied to customer desires and organizational strategies that would be a different matter, but they generally seem to be tied to arbitrary targets.
Brandon – thanks for your comments. There’s SPC that’s used for quality control (is the process for machine engine cylinder bores stable and in control or not… that’s how we used SPC at GM).
Even with mistake proofing that ensures quality, we can still use SPC (the thinking, not just the charts) to understand (and manage) variation in metrics and results in areas like cost, time, etc. Is the process stable in terms of producing a consistent and predictable cost, etc.? That’s what SPC can teach us… and prevent us from overreacting to every up and down in the data, etc.
I really like Wheeler’s process behavior chart vocabulary. “control” just carriers too much inappropriate association.
The “control” is meant to indicate whether or not the process is in statistical control or not. It’s not meant to indicate controlling people, of course. But maybe “process behavior chart” is better language.
I also wish the C in DMAIC stood for “continuously improve,” not “control” but for slightly different reasons.
Indeed an interesting post. Some of the comments and the main text offer some good tips for dialogue with management.
I think if more people read e.g. Shewhart’s 1939 book (even though it is a tough read) it would help people to better understand what SPC is. It has certainly helped me to avoid being misled by some of the six sigma nonsense I have seen. I don’t mean to say that we should remain stuck in the 1930’s, far from it, but some of the key ideas from books like Shewhart’s remain very relevant (e.g. Monitoring a process with a control chart is a limited use, as Mark points out).
Finally the work of Myron Tribus is well worth reading.
Thanks, Scott. Here is a link to that Shewart book:
Via Amazon
[…] that it took 30 mins 20 secs. yesterday and 29 mins 12 secs. today is what is referred to as driving by looking in the rear view mirror. It doesn’t help me look […]