


Here's the latest cartoon collaboration with a skilled artist and medical assistant, Carrie Schurman (see past cartoons). You can find her on Twitter as @carrieschurman.
The idea for this cartoon came from Maggie Millard, the director of marketing at KaiNexus. Maggie has learned about Process Behavior Charts from me and some of the stories are incorporated into my book Measures of Success.
See this blog post for one example of that application of PBCs:
Anyway, Maggie was on a conference call and heard a reference to an “out of control chart,” which is one way of saying a metric (and the underlying system and processes) is not predictable.
Here is the doodle that Maggie made and sent to me:
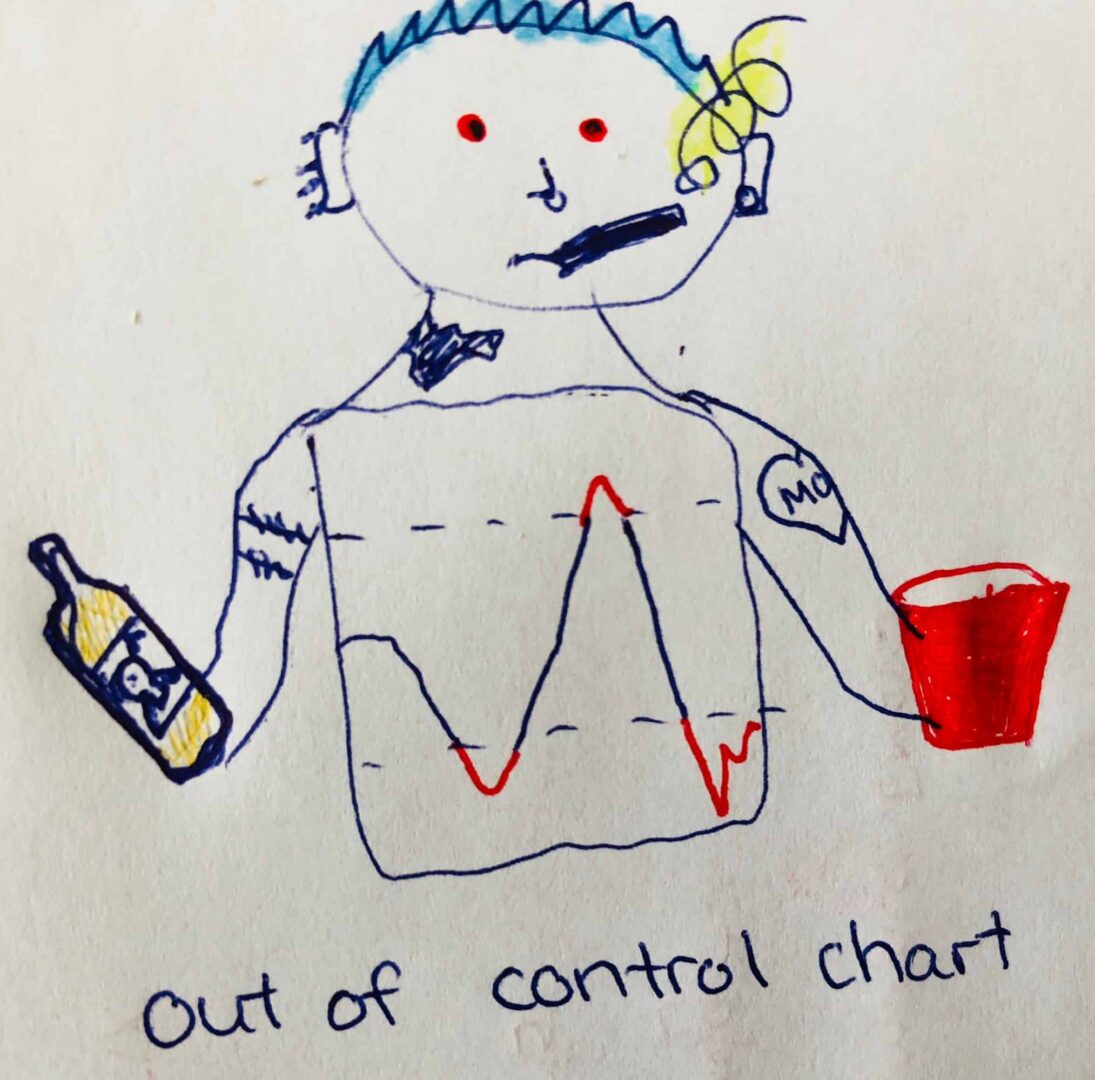
The liquor bottle, the tattoo, the red solo cup, the blue hair, the cigarette… yeah, “out of control” in a very different way. It made me laugh and it led to the cartoon collaboration with Carrie:
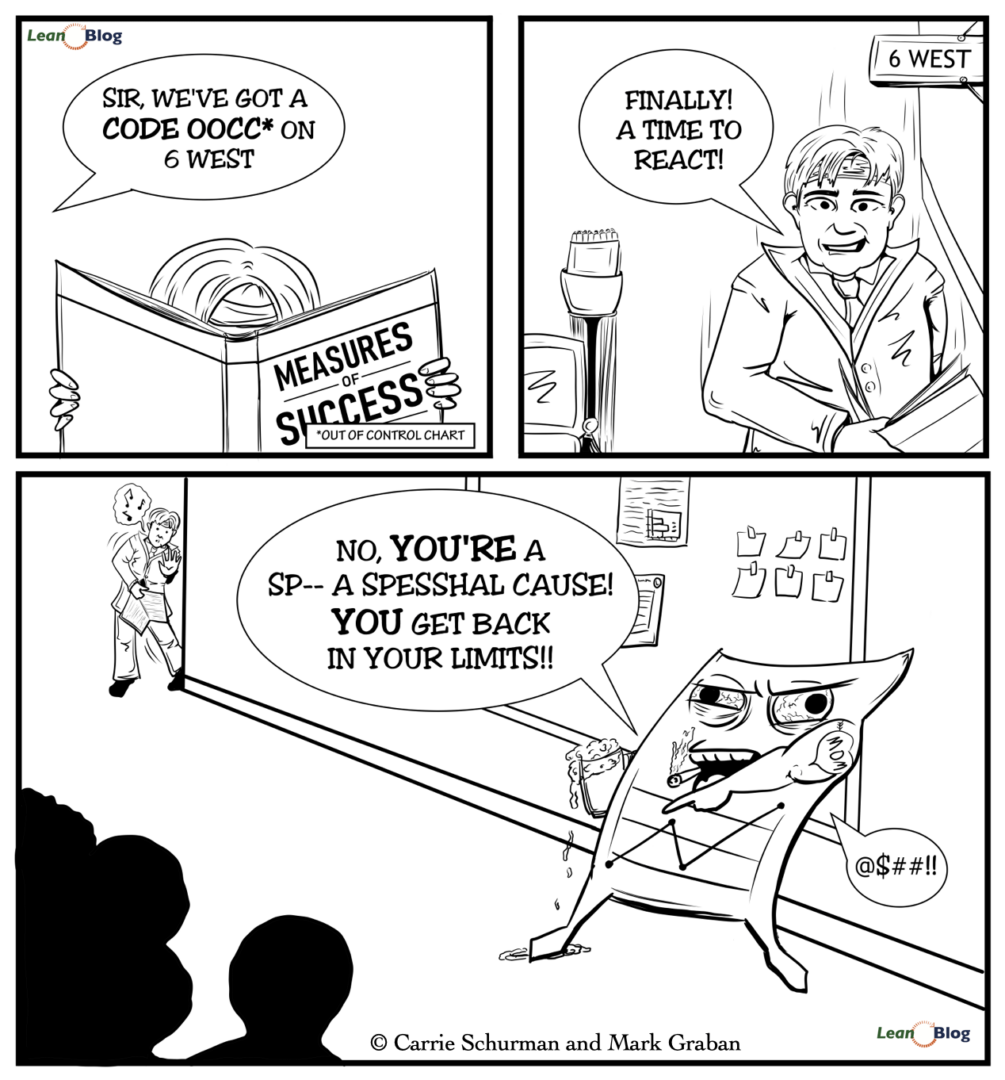
The story is as follows… you might remember the “gemba walking” executive from a previous cartoon who might have mistakenly thought the purpose of the walk was exercise, hence the sweatband and the hand weights:
So, in this cartoon, we imagine that hospital leader has gotten his hands on a copy of my book (although the paperback version still isn't available and hopefully will be by the end of the year — sign up here to be notified of updates).
He's reading, he's learning… he's not reacting to the “noise” or every small up or down in a metric.
But, he gets a call about an out of control chart. In the Process Behavior Chart methodology and parlance, we often say there is a “signal” that indicates that something has changed in the process and it's worth investigating. The term “out of control” comes from the term “Control Chart” or “Statistical Process Control Chart.” I prefer the terms “Process Behavior Chart,” “Unpredictable,” and “Signal,” as taught by Don Wheeler, who wrote the foreword for my book.
Anyway, the executive is excited to have something to react to. To his credit, he realizes he should go to the “gemba” (or the actual workplace) to find out what is happened.
But, of course, he finds something really scary… LOL.
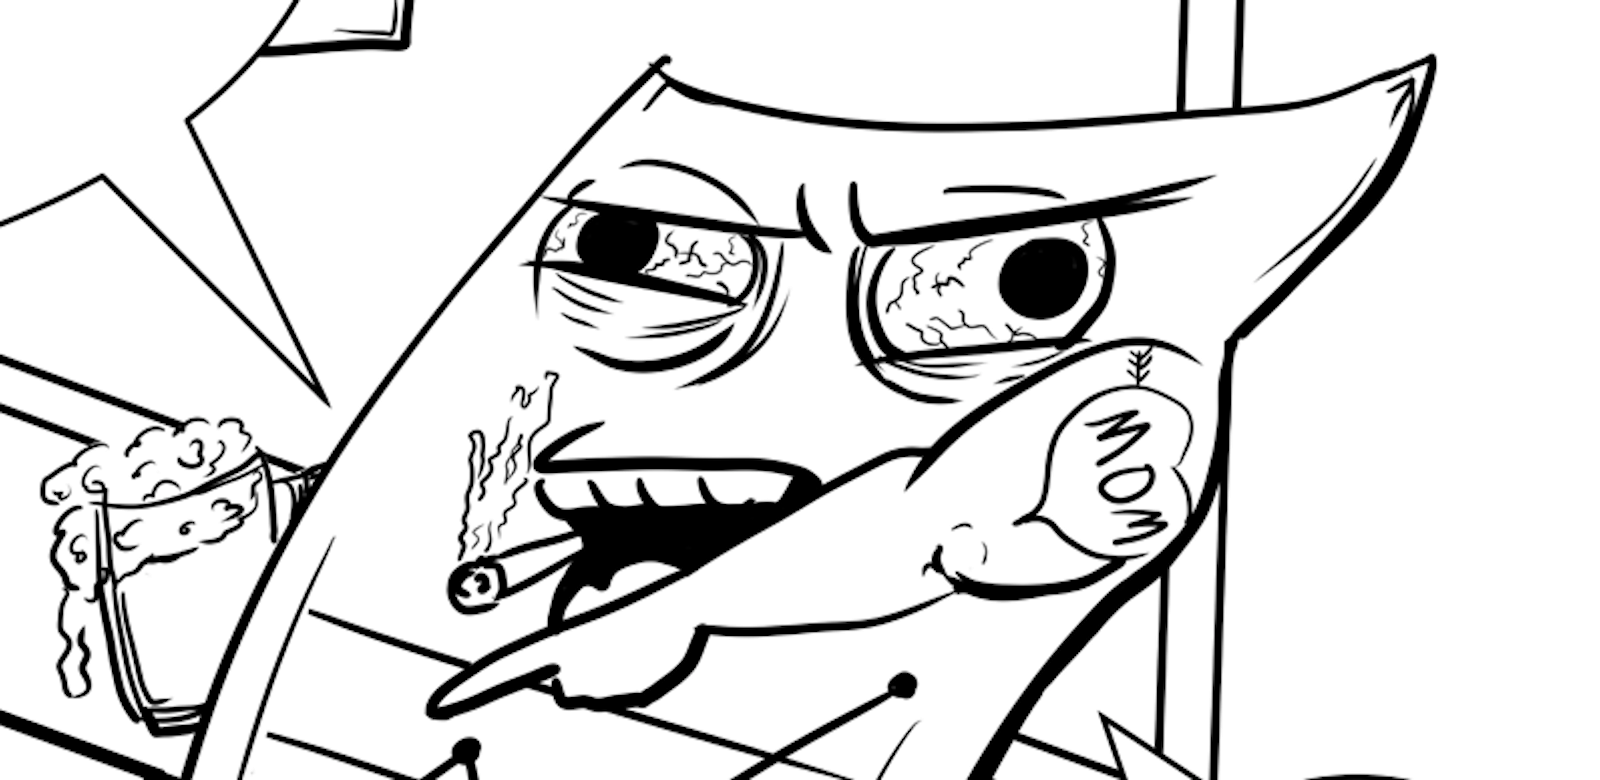
I hope your charts aren't that scary! Finding a signal in a Process Behavior Chart is an opportunity to learn and improve — it's nothing to be afraid of. And my book makes this methodology easy to understand and to apply in your workplace (as the positive reviews on Amazon say).
Thanks again to Maggie for the original concept and thanks to Carrie for collaborating to create a cartoon that I really like…
Update: Here's a webinar where I was dressed in a costume that was inspired by these drawings:
Please scroll down (or click) to post a comment. Connect with me on LinkedIn.
Let’s work together to build a culture of continuous improvement and psychological safety. If you're a leader looking to create lasting change—not just projects—I help organizations:
- Engage people at all levels in sustainable improvement
- Shift from fear of mistakes to learning from them
- Apply Lean thinking in practical, people-centered ways
Interested in coaching or a keynote talk? Let’s start a conversation.


