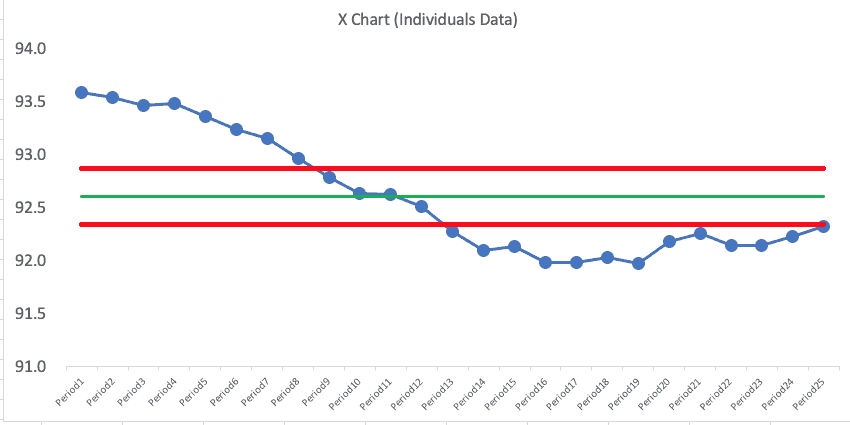
Tag: Process Behavior Charts

Recording: My Lean Startup Webcast on Metrics and Process Behavior Charts

0
Eric Ries and Lean Startup Co. have been really helpful friends in spreading the message about "Process Behavior Charts" in their community. They invited me to give a talk at last year's Lean Startup Week and Eric was kind enough to endorse my book Measures of Success (paperback coming soon - get notified or pre-order)... Recently, they invited me to be a guest for their webcast series, where Marilyn Gorman asked me questions about my book and the Process Behavior Chart methodology. It was a challenge to talk about this visual method without slides and charts, so I did my best to create air charts with finger gestures :-)

Videos by Skip Steward That Explain Routine Variation and Rules for...

0
You might remember the podcasts that I did with my friend Skip Steward, the Chief Improvement Officer at Baptist Memorial Health Care in Tennessee (links below). Skip recently created some excellent videos that explain the basics of "Process Behavior Charts," a method that I explore in my book Measures of Success: React Less, Lead Better, Improve More. See those videos below the podcast links.

A Reader Question about Process Behavior Charts and Business Metrics

5
This content originally appeared in a post about my Halloween metrics webinar, but I decided to carve it out (not like a pumpkin) into its own post. A reader asked: "Should we be using financial statements in that way or is there a better approach given our knowledge about different types of variation? Or am I completely off track?"

Boo! Webinar Recording! Metrics & Statistics Don’t Have to Be Scary

0
I'll be presenting a free webinar on Wednesday, October 31st at 1 pm ET... as you might notice, that's Halloween day! Here's the description from the KaiNexus website: Metrics & Statistics Don't Have to be Scary

Any Four Data Points Might Make Things Look Good, But…

1
Why do we have to be skeptical or careful when we see a chart with just four data points? Does such limited data help prove that our consulting work or our Lean Sigma project has made a difference?

One Way to Improve Your Lean Daily Management Board: From Lists...

9
The other day, I saw a post on Twitter that included a few photos related to what's often called Lean Daily Management practices in a hospital. The spirit of my post is not meant to come across as "they're doing it wrong" but more in the spirit of "they're doing a lot of great things, but it would be better if..." If Lean Daily Management is supposed to be, at its core, about identifying opportunities for improvement, I'd hope they wouldn't be offended by my recommendations, but I also don't want to link to the Twitter post or call them out by name. I will pass along private feedback through a channel I have. But, I'm writing a post because what I see here is VERY common in different organizations (not just healthcare).

Look Out! Be Careful! That Chart is Out of Control!?!

0
Here's the latest cartoon collaboration with a skilled artist and medical assistant, Carrie Schurman (see past cartoons). You can find her on Twitter as @carrieschurman. The idea for this cartoon came from Maggie Millard, the director of marketing at KaiNexus. Maggie has learned about Process Behavior Charts from me and some of the stories are incorporated into my book Measures of Success.  What does this "out of control chart" look like and why did it make me chuckle?

Unveiling Baseball’s Home Run Secrets Through Statistical Process Control: Insights from...

2
If you're not a baseball fan, I apologize for a second baseball-themed post this week. Baseball has a lot of historical time-series data to work with and analyze. If you're not interested in "Process Behavior Charts" or similar methods, I guess I will apologize for this post again too. Next, I'll be apologizing for apologizing. But, I am at Dr. Wheeler's four-day workshop on "Understanding Statistical Process Control" as I blogged about on Monday. It's great to learn from Dr. Wheeler in person and I'll be sharing reflections on the class in a later post (and I'm posting a few things on LinkedIn along the way). In Chapter 1 of Understanding Variation, Dr. Wheeler points out how charts or graphs are far superior to tables or lists of numbers. He uses a baseball example:

Taking Don Wheeler’s Class; MLB Batting Averages are Lower… So What?

8
I recently saw this headline: Baseball on pace for lowest batting average since 1972 Just because it's the lowest average in 48 years... it doesn't mean that this year's MLB-wide batting average is low in a way that's statistically meaningful.

Recorded Webinar: Improve Your Lean Management System With a Simple Chart

0
I presented a 30-minute webinar on Monday, August 27 at 1 pm EDT. This one was hosted by Lean Frontiers as part of their summer webinar series.

Podcasts, Videos, and Some Measures for “Measures of Success” [Updated]

0
Here are a few items and thoughts related to "Process Behavior Charts" and my book Measures of Success. I'll share some charts related to sales of my book about charts and management. I'll also share an updated article of mine and two podcasts that had me on to talk about the book.

Recorded Catalysis Webinar: Measures of Success: React Less, Lead Better, Improve...

0
Hosted by Catalysis, I shared some key concepts from my new book Measures of Success (now available in the Apple Books store among other places). This webinar was geared toward a healthcare audience that is also, likely, interested in or practicing elements of Lean Daily Management. This was held Monday, August 20 at noon EDT.