


I was invited to give a presentation on Process Behavior Charts and Measures of Success at Cleveland Clinic last week as part of their Quality Forum series. I always enjoy visiting with them and I walk away very inspired by what they are doing with continuous improvement and daily tiered huddles.
See a previous blog post of mine and a video they have shared about the huddles:
I got to observe many huddles last Thursday and I will be blogging about that soon. I saw or met many of the people you see in the video.
A3 Thinking Around Process Behavior Charts
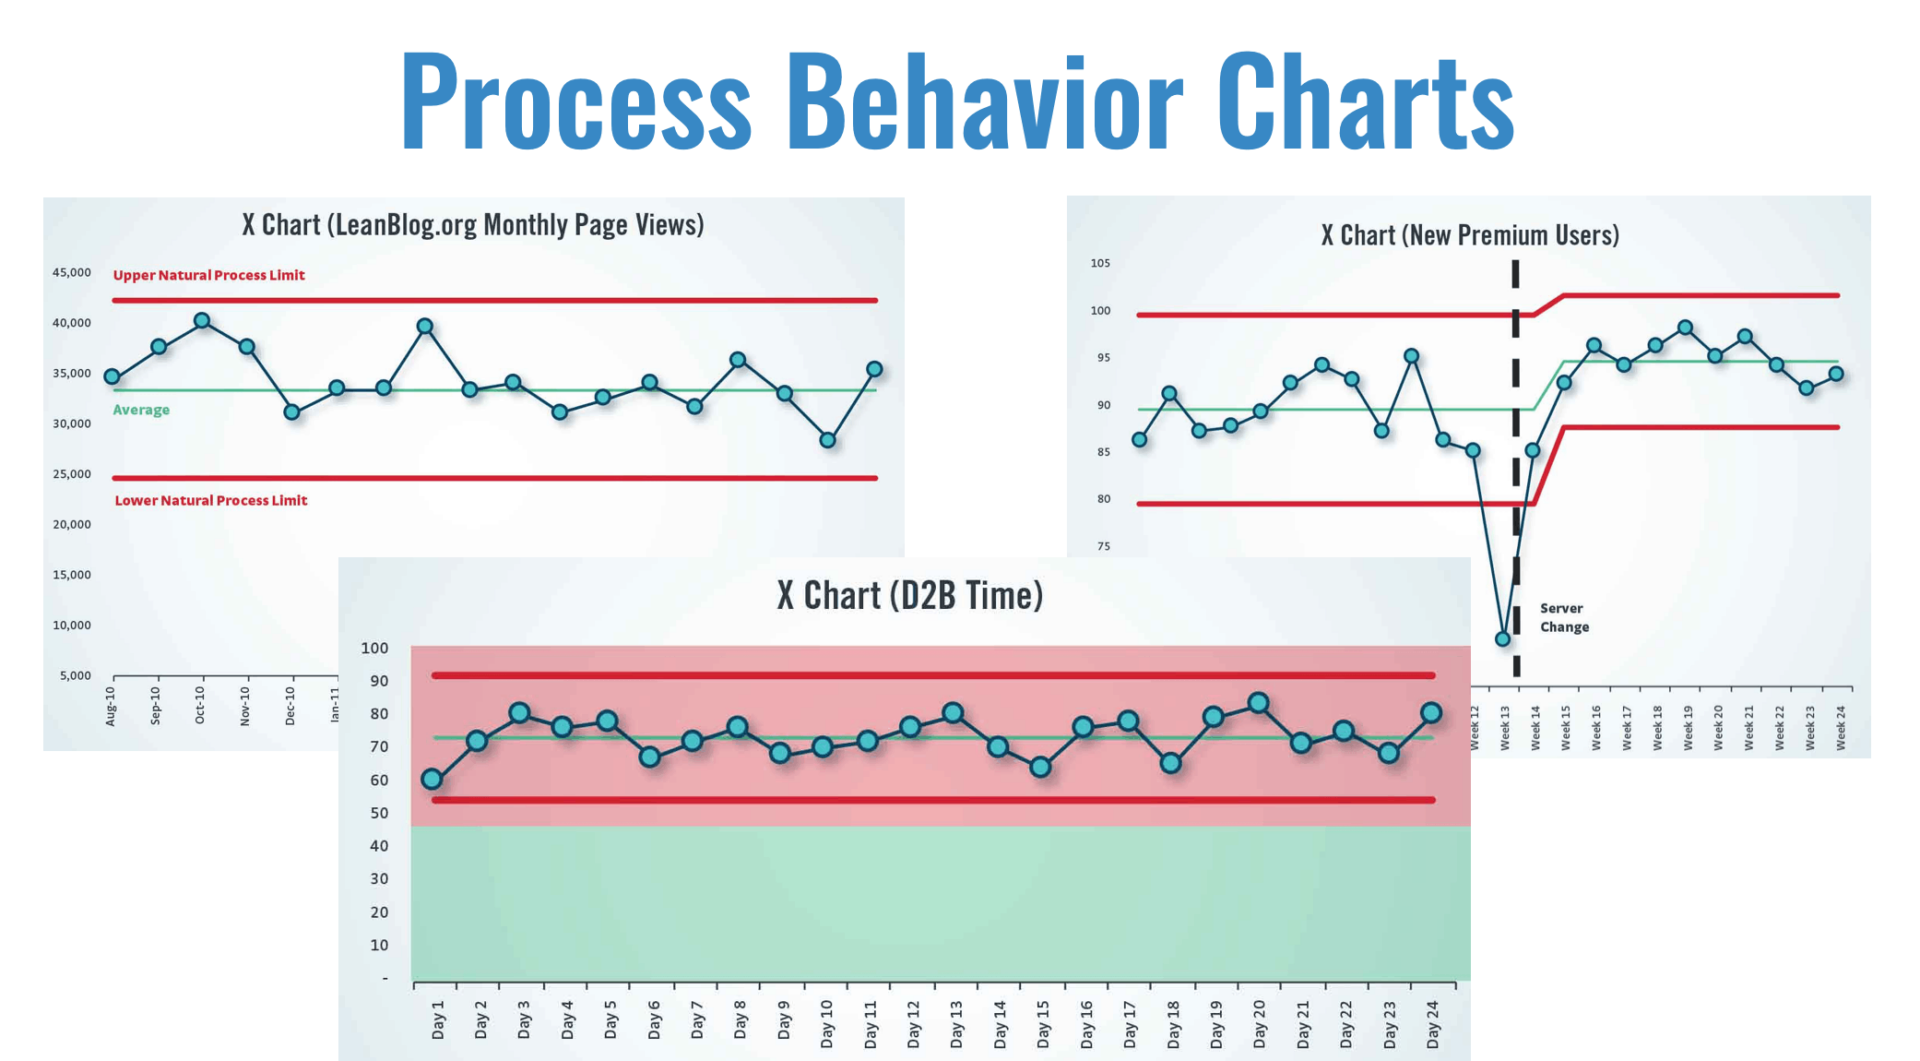
In my presentation, I started by showing a few examples of what Process Behavior Charts (PBCs) might look like.
But, I called “time out” on myself and said:
“Let's not jump to solutions!”
Now, it's not great to go through an A3 with the intent of working toward a pre-ordained solution… so forgive me for that. But, I think it's important to talk about the NEED for solutions and the A3 thought process can help us gain alignment. So, it might have gone something like what follows.
This was the first time I presented things in a pseudo-A3 format. I did so because Cleveland Clinic has used A3s for problem solving in many parts of the organization.
First, below you'll find an A3 template that we use at the firm Value Capture (where I'm a subcontractor with a client right now). There are different A3 templates out there (and I've used different ones), but the exact format and wording
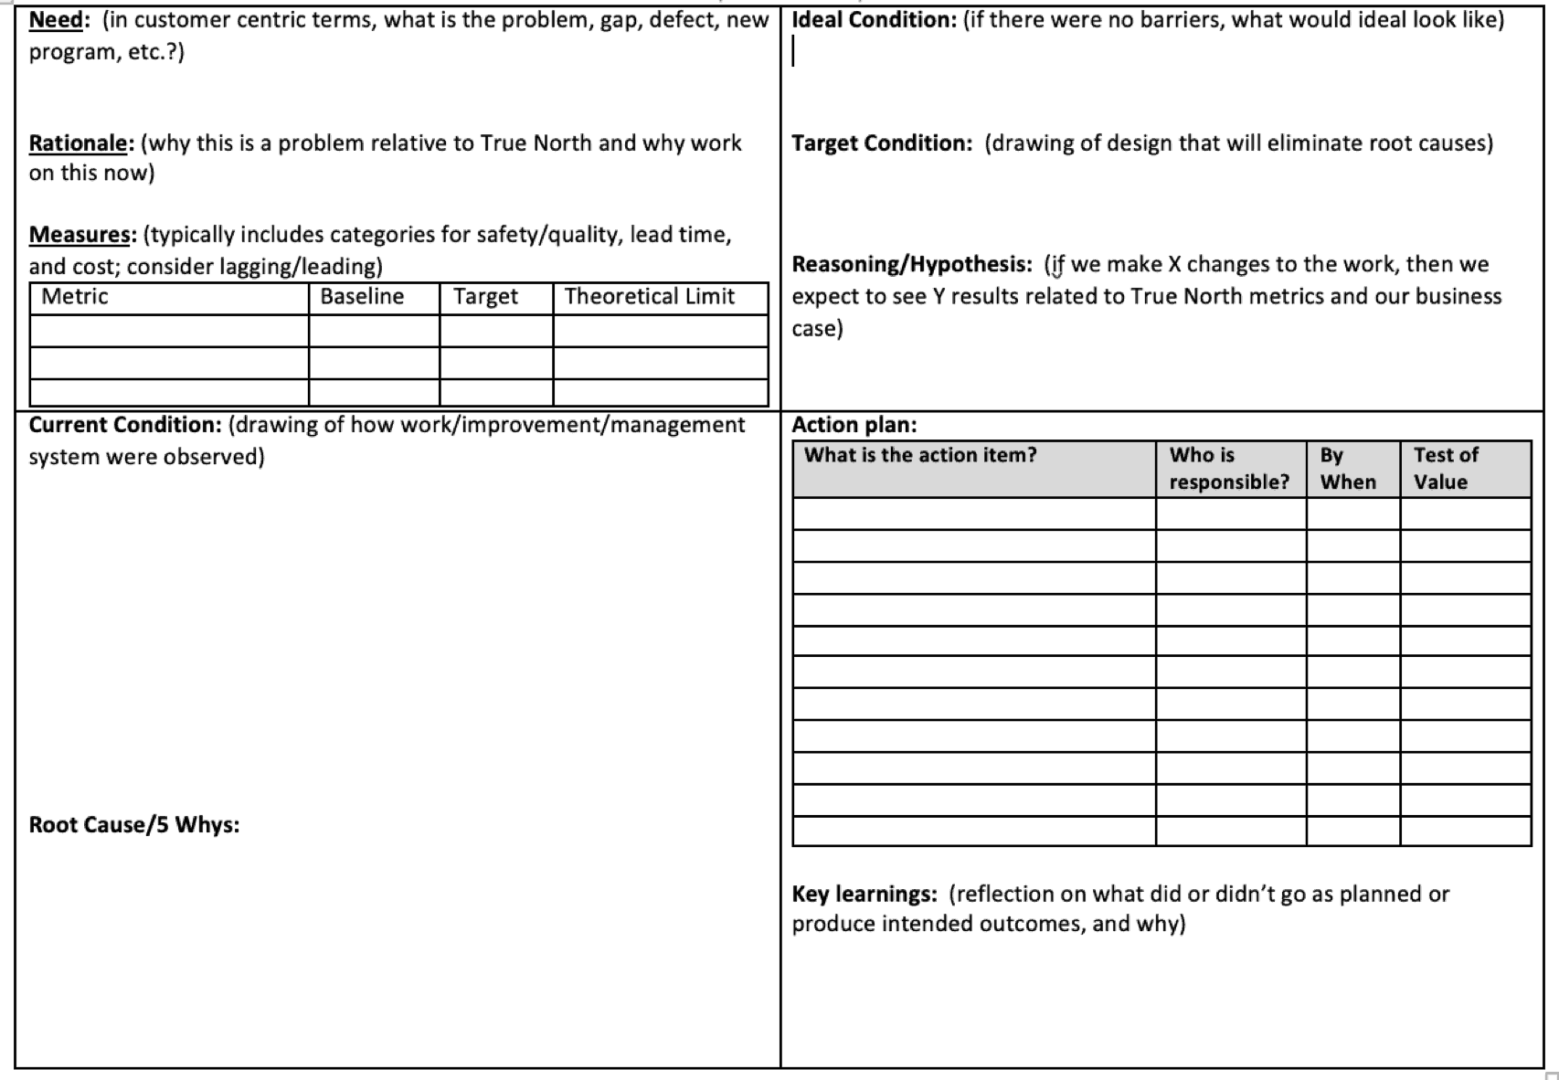
Need
What's the need? What's the problem or gap that we face?
From my perspective, some need statements might include:
- Incorrect conclusions in evaluating:
- Changes in performance metrics
- Impact of improvement efforts
- Wasting time (explaining routine fluctuations)
- Missing signals of a system change
Rationale
If the need statements are the “what,” then the rationale gets into the “why.” Why does this problem matter? Why is it worth talking about?
Some rationale statements might include:
- Overreactions exhaust people
- Faulty conclusions hamper improvement
- Unfair performance evaluation hurts morale
Does the group we're working with agree with the Need and Rationale? Is there agreement that there's a problem? Is there alignment around these being important problems to solve?
I could probably provide some backing statements or examples for my assertions about Need and Rationale
Metrics
Can we measure the current state? Can we figure out how to measure our impact so we aren't just guessing that we have an improvement. Can we know there is improvement instead of feeling like it's better?
Here's what I proposed as metrics, even if these things aren't necessarily easy to measure:
| Metric | Baseline | Target | Theoretical Limit |
| Time spent investigating root causes that don't exist | X hours a week | 0 hours | 0 hours |
| Leader turnover | Y leaders a year | 50% less | 80% less |
| Staff satisfaction | Z % | 50% better | 95% |
When we're asking for a “root cause” for “common cause variation” in a system, that's a waste of time, as I wrote about in this case study:
Current Condition
Here, I shared examples of common practices that aren't really helpful in answering these three important questions:
- Are we achieving our target or goal?
- Are we improving?
- How do we improve?
Practices that don't help much
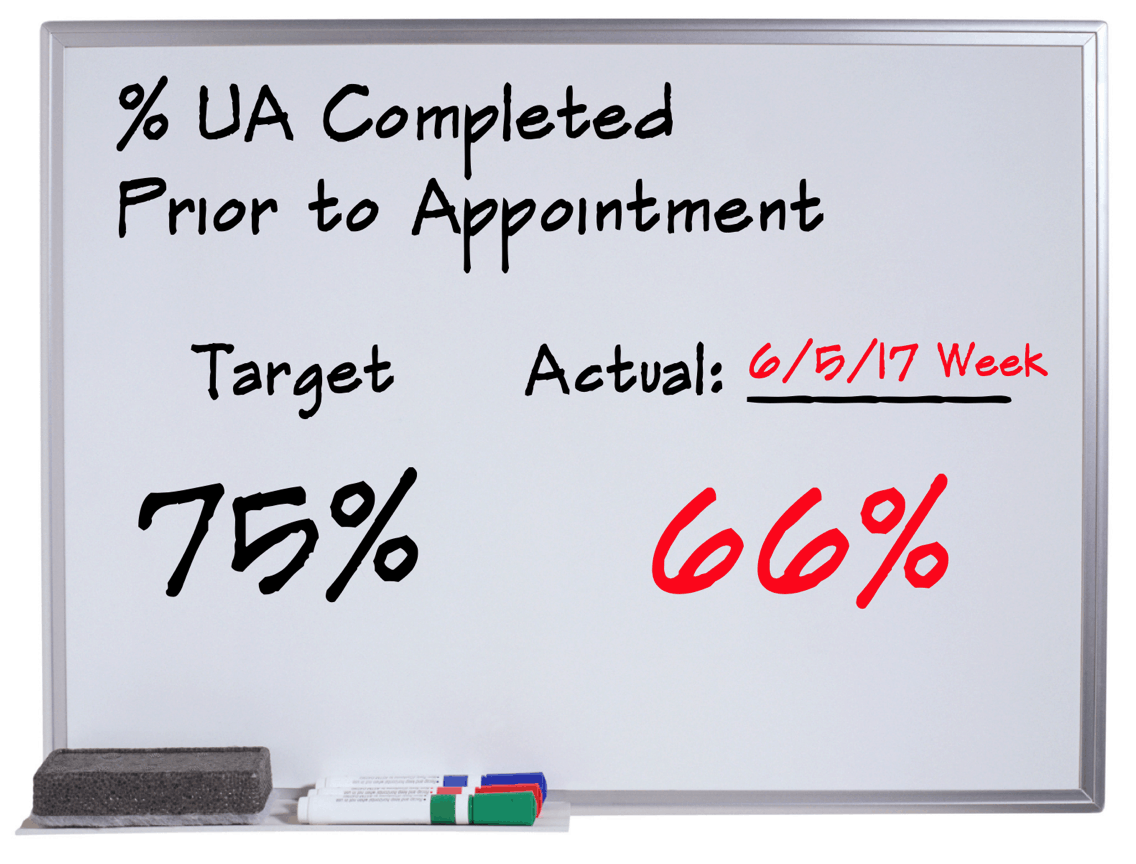
Comparing a single data point to a target:
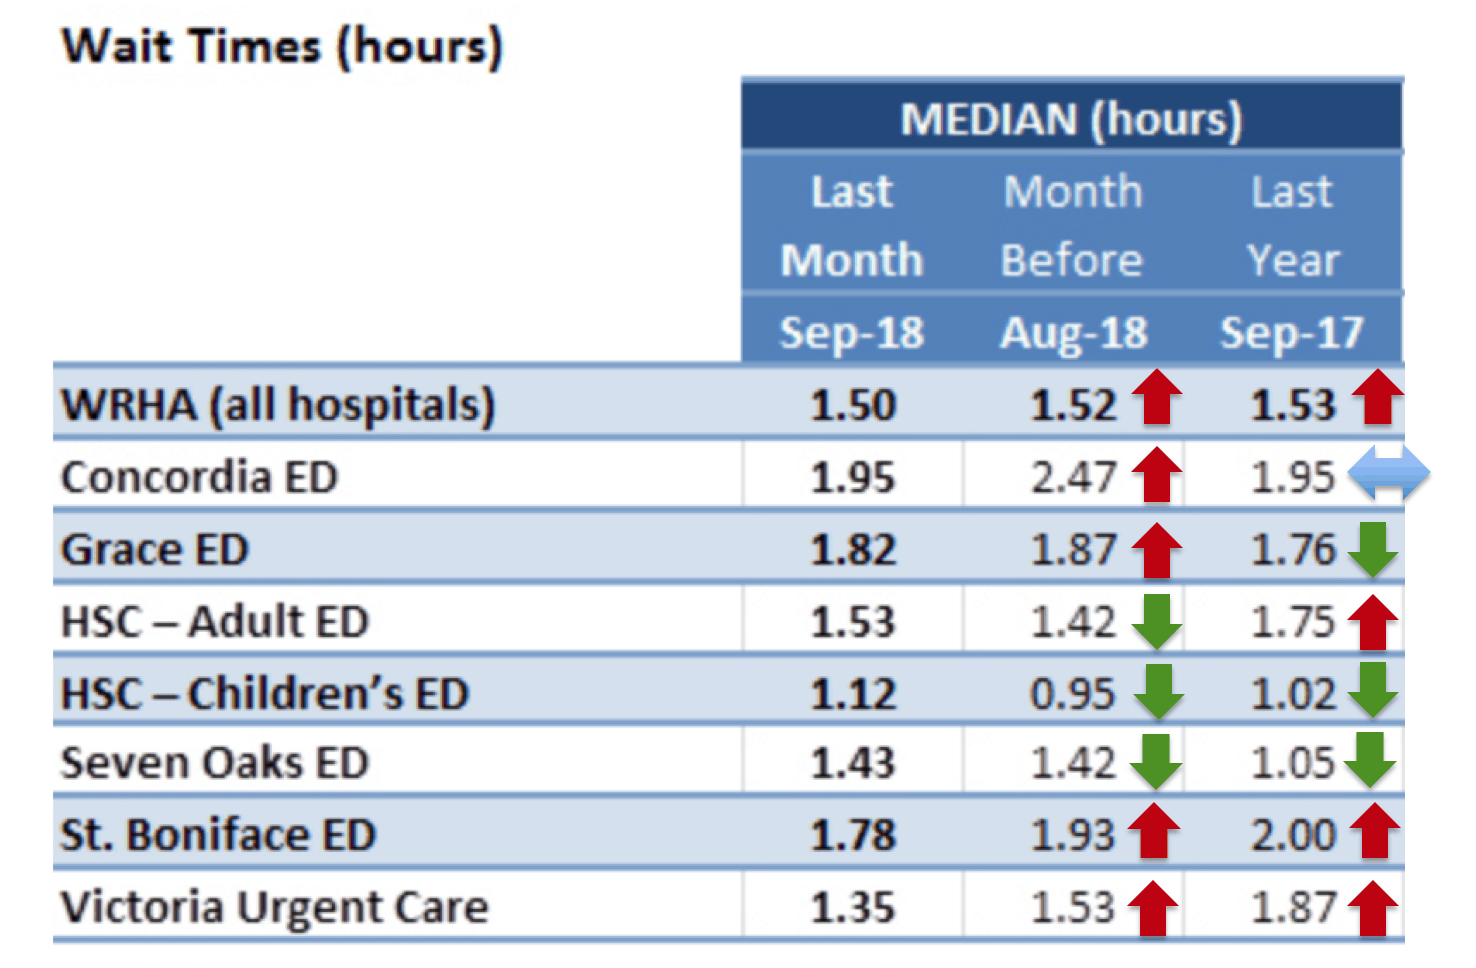
Comparing a single data point to one or two previous data points (with or without color-coded arrows):
“Bowling charts”:
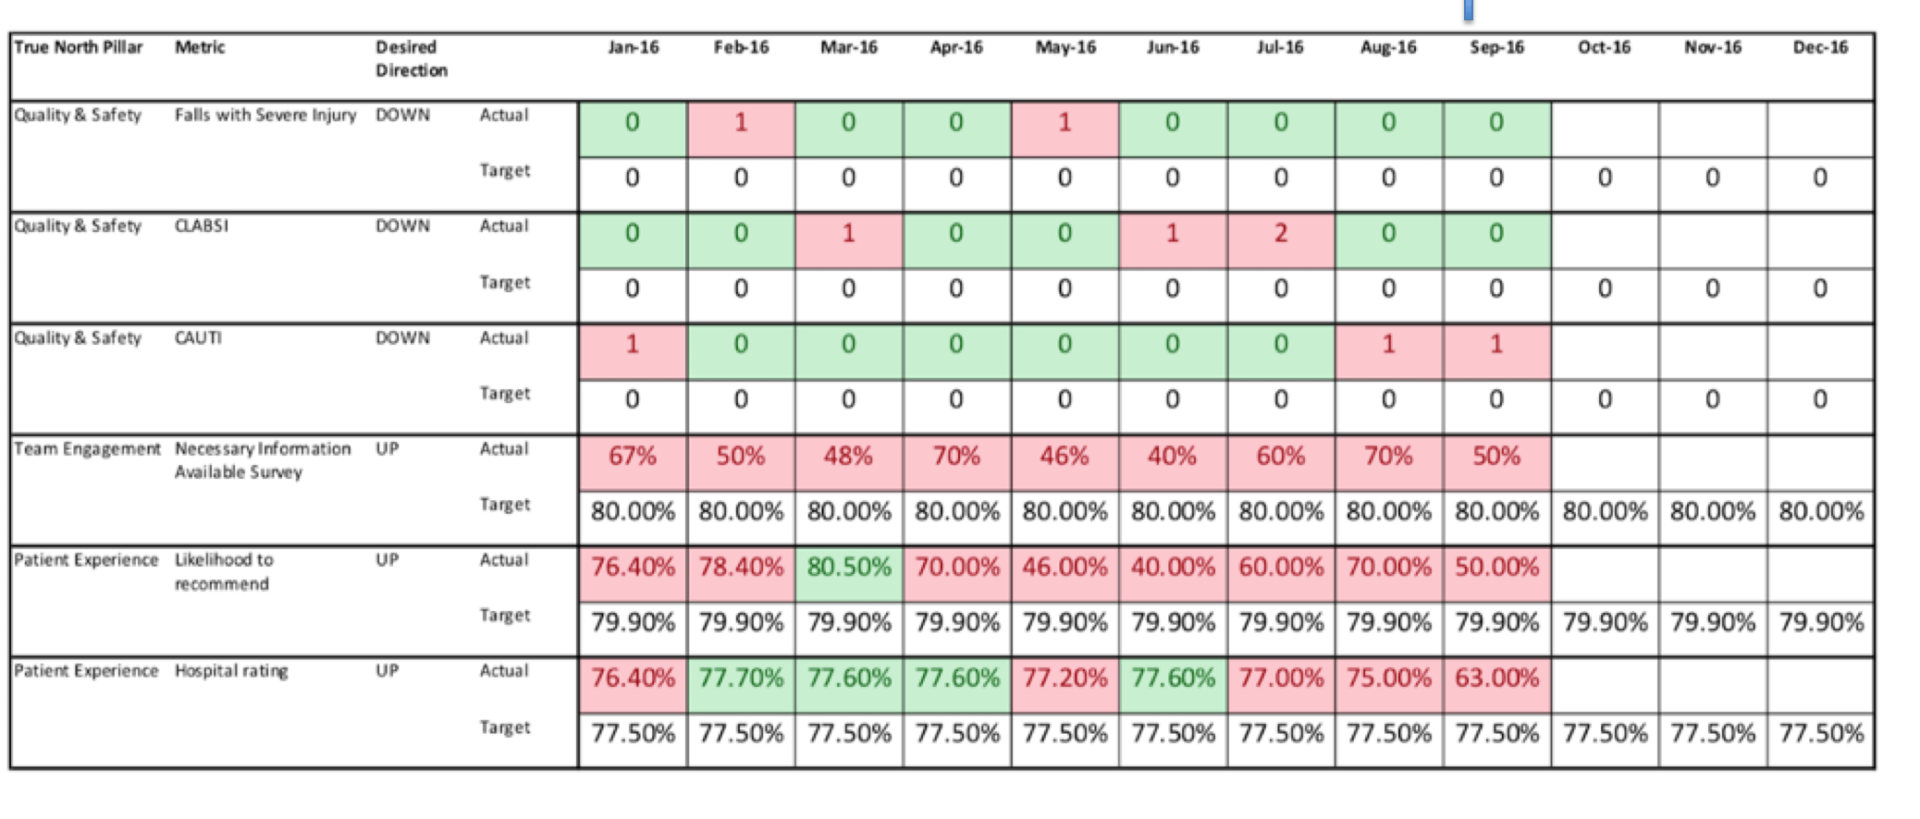
If all we're doing is “barking at the red,” does that require much skill? Does that really help? I showed this cartoon, which always gets a laugh, even if it stings a bit:
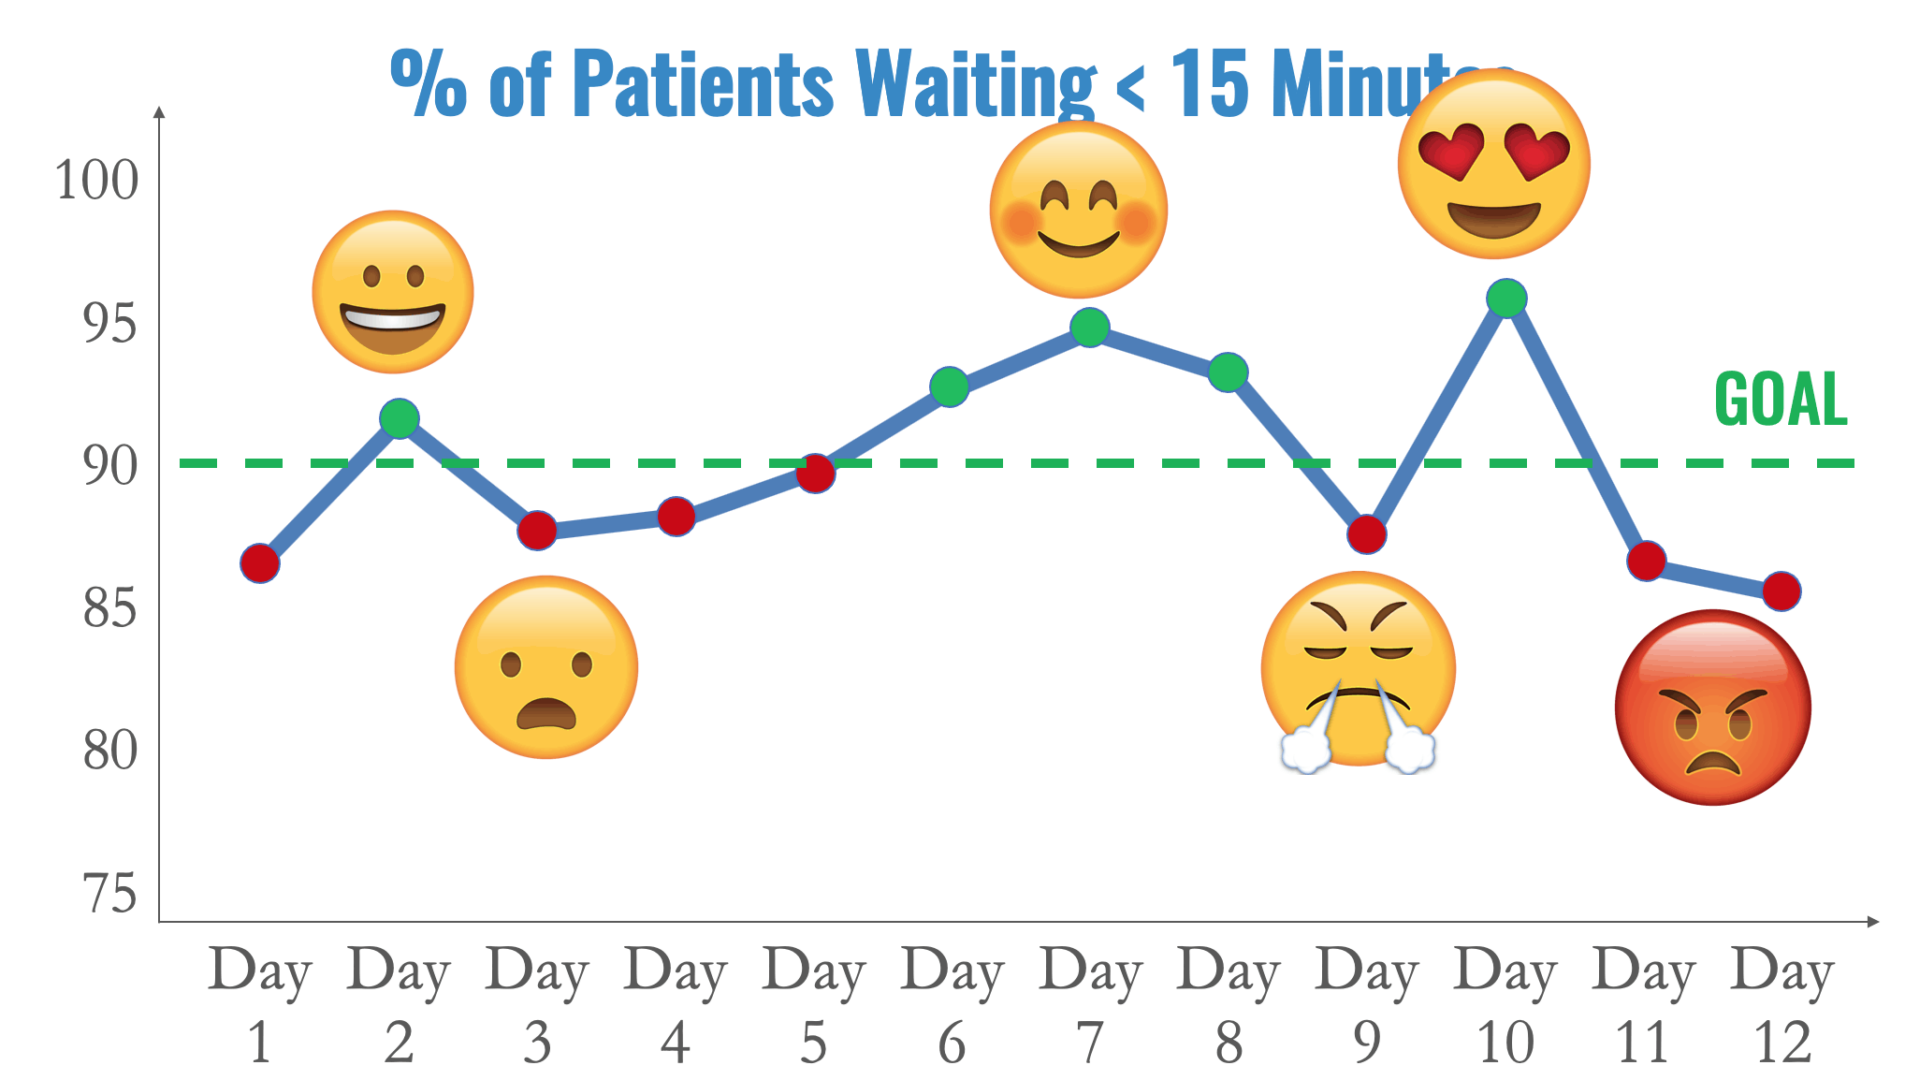
Even run charts aren't super helpful if we're overreacting to every up and down in the metric, as in my “management by emoji” example:
We have to agree that the Current Condition is lacking in some way before it's worth the effort to talk about solutions.
I've long said that:
- Process Behavior Charts are a solution that many don't know about
- Process Behavior Charts are a solution to a problem that many don't recognize as a problem
Causal Analysis
Why is our current state the way it is? Why do we have gaps? I proposed:
- “This is how I was taught to do metrics.”
- “This is just how we do metrics here.”
- “Our Lean consultant showed us to do it this way two years ago.”
In summary, a lack of exposure to Process Behavior Charts?
We can't blame people for not knowing something they haven't been taught. Most people haven't ever been taught how to apply “control charts” or “statistical process control” to metrics. PBCs are a form of “control chart,” although I don't like using that word for a number of reasons.
Target Condition
Our target condition should include methods that allow us to answer those three questions. The countermeasure I propose is PBCs.
Here's a PBC for that “management by emoji” example:
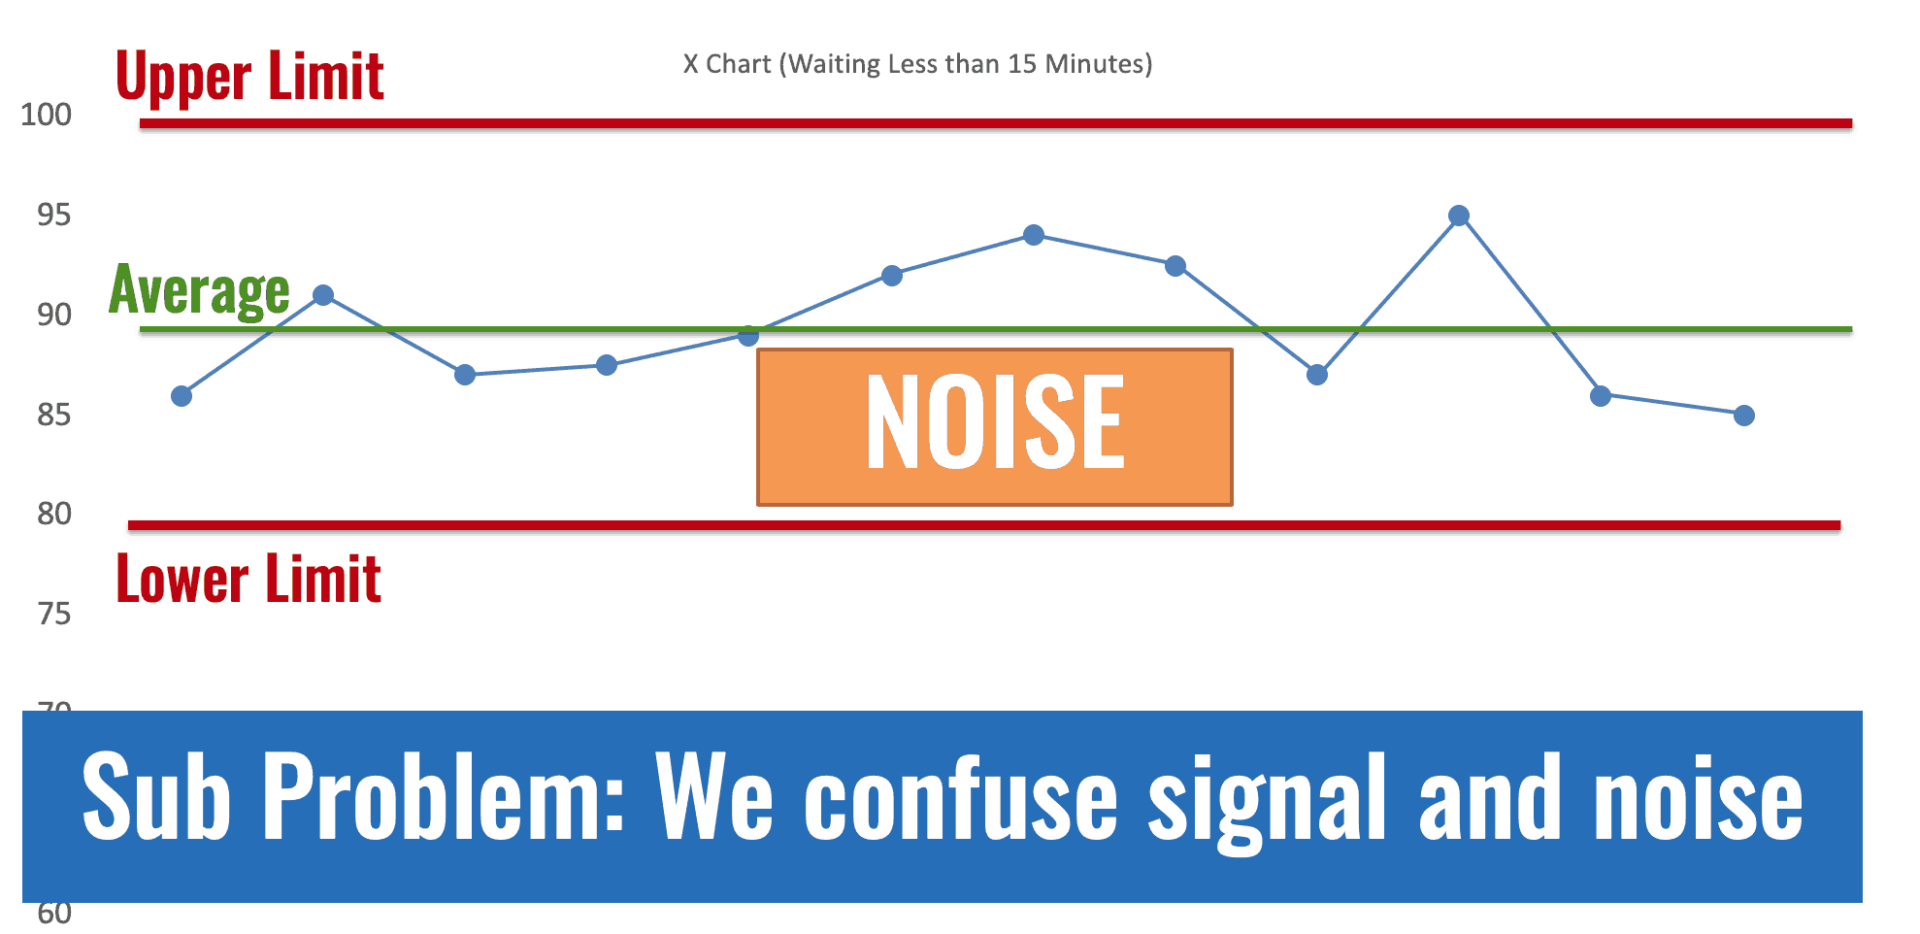
We would do better if we stop reacting to noise. Don't ask people to explain noise. Don't ask for root causes of data points that are noise.
Later in the day, we had a couple of good discussions about PBCs. There were questions about:
“What do we want leaders to do?”
One answer might be to react appropriately to signals, when we see them.
I proposed that another important question is:
“What do we want leaders to STOP doing?”
We want them to stop overreacting to noise. That's a REALLY hard habit to break.
Here's an example of a PBC with three different types of signals. THOSE are the times when we should ask, “What happened?”
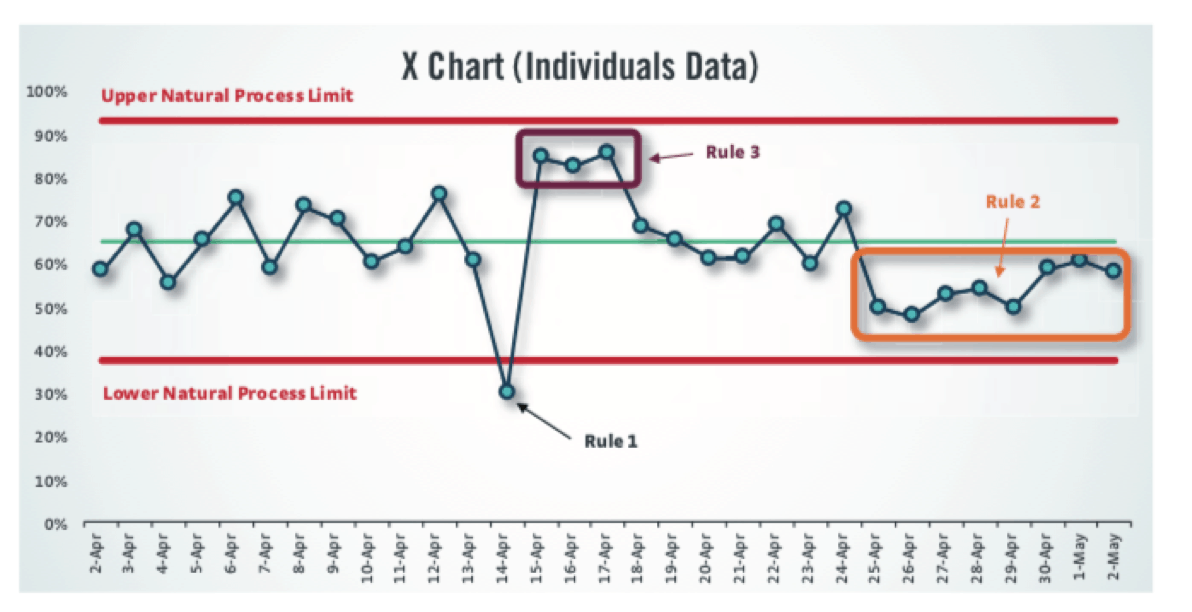
The three main rules for finding signals are, as illustrated above:
- Rule 1: Any single data point outside of the limits
- Rule 2: Eight consecutive points on the same side of the average
- Rule 3: 3 out of 3 (or 3 out of 4) points that are closer to the same limit than they are to the average
I shared some examples of PBCs and how they're used to:
- Evaluate an improvement effort to help see if it's really made a difference
- See if there's an unexplained signal in a metric that's worth investigating
The point is not to just create PBCs. The point is to use PBCs to help us get better at getting better — improving the way we evaluate improvements.
Hypothesis
Here's the hypothesis I would pose:
“If we react less (only to signals),
we can lead better,
and we'll have time
to improve more”
Do you agree with Process Behavior Charts as a countermeasure? Do you first agree that we have a problem? Do you agree with my hypothesis? Have you been able to test it in a meaningful way?
If we have alignment, then we can move forward to “Action Plans” and then we can review our Hypothesis to see if there are “Key Learnings.”
That's a rough “A3” structure for looking at Process Behavior Charts. How would your A3 for this be different?
Thanks again to the folks at Cleveland Clinic for the thought provoking two days together (we also did my workshop together on Friday).
Please scroll down (or click) to post a comment. Connect with me on LinkedIn.
Let’s work together to build a culture of continuous improvement and psychological safety. If you're a leader looking to create lasting change—not just projects—I help organizations:
- Engage people at all levels in sustainable improvement
- Shift from fear of mistakes to learning from them
- Apply Lean thinking in practical, people-centered ways
Interested in coaching or a keynote talk? Let’s start a conversation.


Did .you intentionally not explain Rules 1, 2&3 in the Noise Chart example? I was left hanging.
Hi – Thanks for reading. I illustrated the three main rules in a chart lower down, but I also added the text explaining those rules:
* Rule 1: Any single data point outside of the limits
* Rule 2: Eight consecutive points on the same side of the average
* Rule 3: 3 out of 3 (or 3 out of 4) points that are closer to the same limit than they are to the average
To my hypothesis, here is one reader story that was shared in an Amazon.ca review:
Hi Mark – thank you for joining us, and I do appreciate the A3 thinking. A big part of why we are headed down this path is actually related to strategy execution. If we want to ensure teams can focus on the most important items and attack them with good A3 thinking then we need a way to have confidence that the other metrics are just moving around noise and get a clear signal when something that has changed. A reality is we all have lots of metrics we are responsible for, that will not change, nor should it. We need a clearer way to indicate when we should take action and when we shouldn’t.
Thanks, and thanks, Nate. Your comment is a good summary of the mindset.
I’d add that when a metric is predictable (just fluctuating, or noise) but it’s not capable (not anywhere near consistently hitting the goal), then we can “take action” but the action should be a systematic analysis and improvement method (like A3) instead of just being reactive. Look at a system instead of looking at a data point.
Great post. Keep em coming. Is there a rule of thumb as to the correct interval these metrics should be kept (ie – hourly, daily, weekly, monthly, quarterly, yearly)? It seems what may be a signal at one level would be simply noise at another.
Hi Jeff – Thanks and great question.
If the data is basically free and it’s easily available, I’d always rather do a daily chart than a weekly chart… a weekly chart is better than a monthly chart.
Two reasons:
1) You’ll see signals and shifts more quickly with a faster cycle / shorter interval chart. The limits are calculated in a way that helps you not overreact to, say, a daily chart that’s bound to have more point-to-point variation than a weekly or monthly chart would. The limits will be wider when you have more point-to-point variation.
2) Sometimes a signal gets “lost” when it’s averaged out into a weekly or monthly metric. A weekly signal might be lost when averaged out into a monthly metric.
Again, if the cost of collecting data daily is outrageous, or if the metric HAS to be monthly for some outside reason (regulatory, etc.) then the best you can do, frequency wise, is the best you can do…