

Did an Oscars Ceremony With No Host Affect TV Ratings? A Data-Based Look
tl;dr: Year-to-year changes in Oscars TV ratings are usually just noise, not meaningful signals. Blaming or praising the host (or lack of one) based on small fluctuations is a mistake. Looking at longer-term trends with tools like Process Behavior Charts helps leaders stop overreacting and focus on changes that actually matter.
Every year, the Oscars produce the same cycle: headlines, hot takes, and confident explanations for why the ratings went up or down. Was it the host? The jokes? The movies? The length of the show? The lack of a host?
What almost nobody asks is a more basic question: was the change even meaningful? Before we assign credit or blame, it's worth stepping back and asking whether we're reacting to a real signal–or just telling stories about noise.
With Kevin Hart now definitively stating that he will not host the 2019 Oscars, it appears that the ceremony will move forward with a variety of actors and celebrities sharing hosting duties throughout the night (see “Will the Oscars Be a Hot Mess Without a Host?“).
Update: Scroll down to see how the 2019 ratings turned out.
Over the years, different hosts have been scrutinized not just for their jokes, songs, or dancing – but also for the impact that experts or journalists say they have on any given year's TV ratings, as I blogged about last year.
Many who analyze these numbers each year make the common mistake of overexplaining every relatively small fluctuation. Sometimes a new host gets too much credit for an uptick; sometimes a host takes too much blame for a small, but statistically insignificant, drop in the ratings.
Long-Term Trends vs. Year-to-Year Noise in Oscars Ratings
Over the past few decades, ratings for the Oscars have fallen significantly, from a Nielsen rating of 38.0% in 1984 to just 18.9% in 2018. There are many reasonable explanations for the long-term trend, including the expansion of cable television and streaming services, which offer so many alternatives for potential viewers.
But when we look at a shorter time frame, like the difference in ratings between any two years or the numbers since 2001, the trend is less conclusive. If you look at any two data points in a metric, one is always higher than the other. It doesn't mean that the difference is statistically significant; it doesn't mean it's worth reacting to.
Why Two Data Points Do Not Make a Trend
The Oscars already tried a one-year experiment without a host in 1989. The ratings that year (29.8%) were higher than in 1988 (29.4%), when Chevy Chase hosted.
Statistically speaking, those numbers are essentially the same – think of the TV ratings estimate as being similar to political polling, which consistently reports a margin of error. It's possible that more people actually watched in 1988.
We shouldn't overreact to or overanalyze that difference any more than we should overexplain how ratings fell to 27.8% in 1990 when a host was added again, this time Billy Crystal. The ratings for all three years were essentially the same.
I wouldn't conclude from that experiment that “no host” would be the best strategy going forward, nor that Crystal is less popular than Chase. Two data points (or three) are not a trend.
Using Process Behavior Charts to See Signal vs. Noise
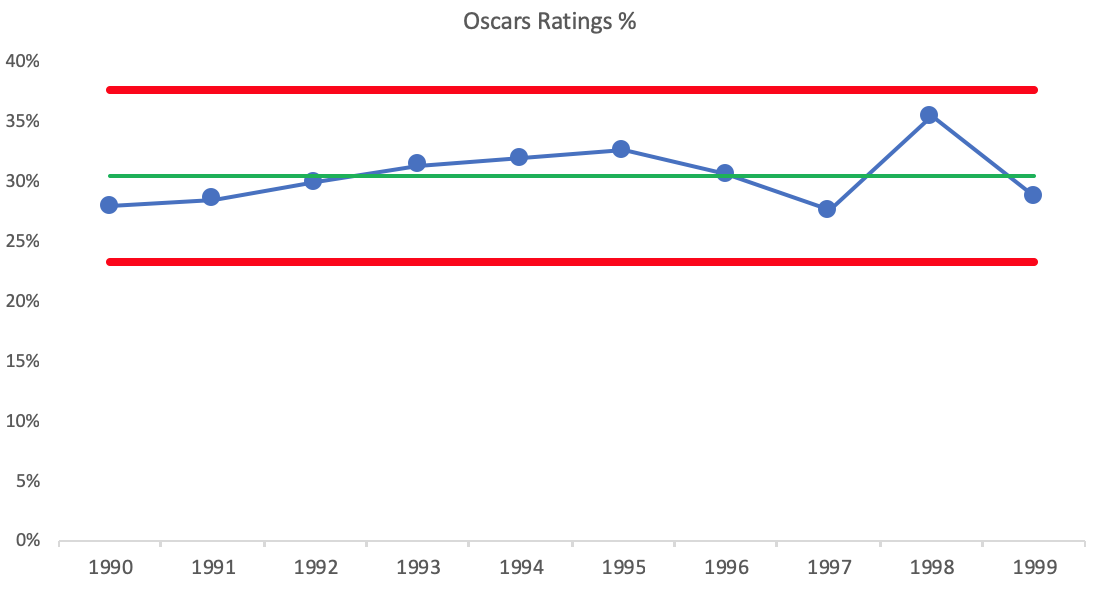
Over the 1990s, ratings fluctuated around an average of 30.4%, as charted below. A statistical method called a “Process Behavior Chart” (used here, as described in my book Measures of Success) shows us that some years are higher than others; some are above average and some are below average. Any year's number between the red lines (which are calculated, again, see my book or this blog post) is basically just a random fluctuation.
There's no particular cause for any year's number within that range (although experts claim the ratings were higher in 1998 due to the movie Titanic). A statistical view shows that, yes, that number was the highest in a decade, but it's still within the “margin of error,” essentially. The number goes up, the number goes down.
As more years get added to the chart, we'd look for three possible “signals” that ratings have gotten significantly better or worse:
- Rule 1: Any data point outside those limits
- Rule 2: Eight consecutive data points above the baseline average
- Rule 3: Three out of four consecutive points that are closer to a limit than the average.
Any of those three events is not likely to be the result of randomness or “noise” in the ratings measure. When we see “noise,” it's a waste of time to investigate or identify a particular cause for the change. When we see a “signal,” there is a meaningful change that's worth understanding and explaining. This is true with ratings for the Oscars or any performance measure in your own business or organization.
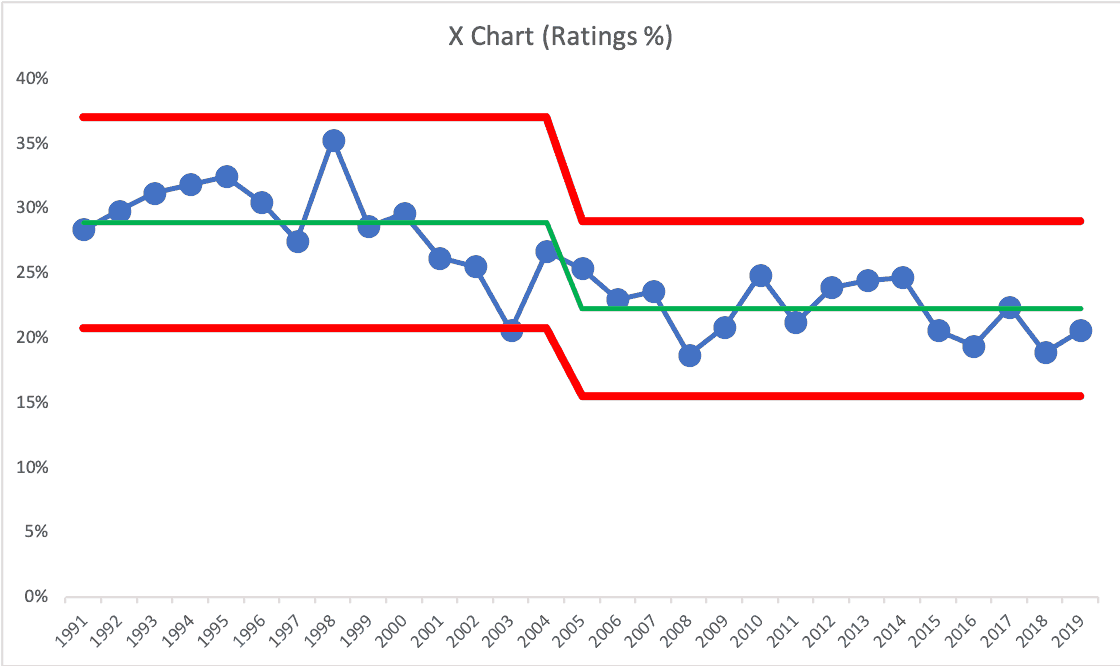
What Actually Changed in the 2000s
How did the numbers look as we turned into the 21st century? See the chart below:
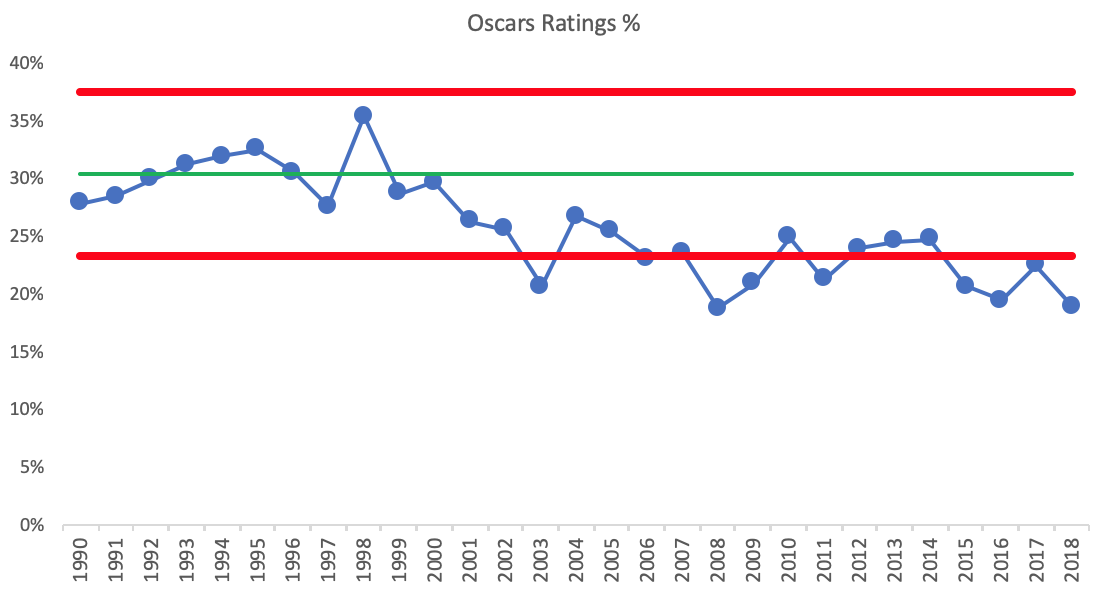
In 2003, we see a signal that tells us something changed significantly (for once): that year's ratings are below the lower limit that predicted what future ratings would have been if they continued to fluctuate around an average. The year 2003 is also the third consecutive year that triggers a Rule 3 signal. Then, we see 2007 as the year with the eighth consecutive point below the 1990s average.
It's clear that something changed – ratings are now significantly lower than before – but what changed? And when?
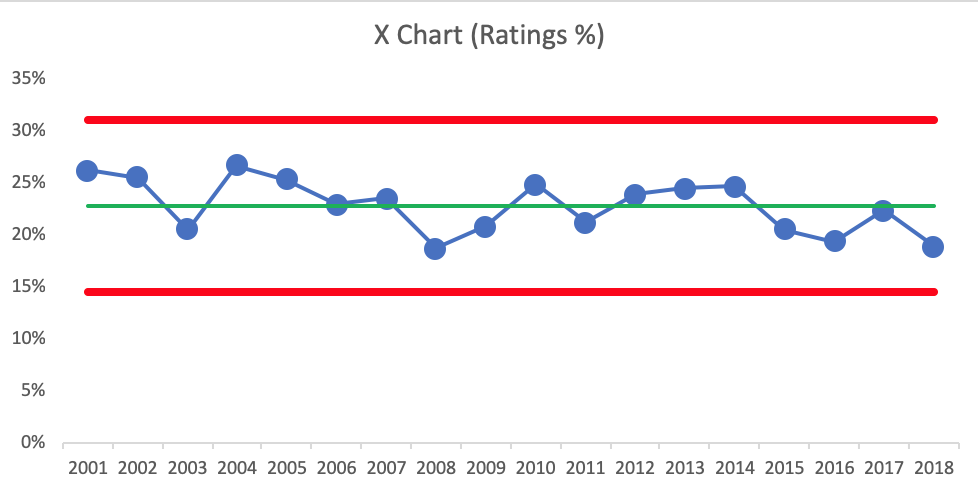
If we create a Process Behavior Chart for the years 2001 to 2018, we see that ratings are now fluctuating around an average of 22.8%. That's clearly lower than the average in the 1990s. It would be suitable for the Academy and ABC to understand why there was a downward shift from the 1990s to the 21st century, but explaining the difference doesn't mean they can necessarily do anything about it.
Why Reacting to Annual Ratings Changes Is a Waste of Time
What's not a good use of time is asking or explaining why the number rose or fell in any of those given years. How many hosts have been replaced because of their “low” ratings when their year was within the margin of statistical error?
If the Oscars go without one official host this year, ratings might tick up a bit. Or they might go down slightly. But if that number is between the limits of 15% and 31%, the Academy and ABC shouldn't overreact. If we see the four years also falling below the average of 23%, giving us eight consecutive points below the average, that would be another signal worth identifying and understanding.
What Leaders Can Learn from the Oscars Ratings Debate
Too many organizations and leaders waste time explaining noise in metrics. When we take a longer-term statistical view of a business measure, we can stop reacting to the noise, stop overexplaining the noise, and look (instead) for meaningful signals in the number. That gives us a better chance of actually improving.
Did the 2019 No-Host Oscars Change Anything?
OK, so it's a few days after the Oscars, and the numbers are in. Headlines and articles obsess over two-data-point comparisons and every up and down.
Oscars 2019 Ratings Rise From Last Year to 29.6 Million Viewers
Initial analysis says Oscar TV viewers and ratings are UP over 2018. But, for context, the ratings were DOWN in 2018 compared to 2017.
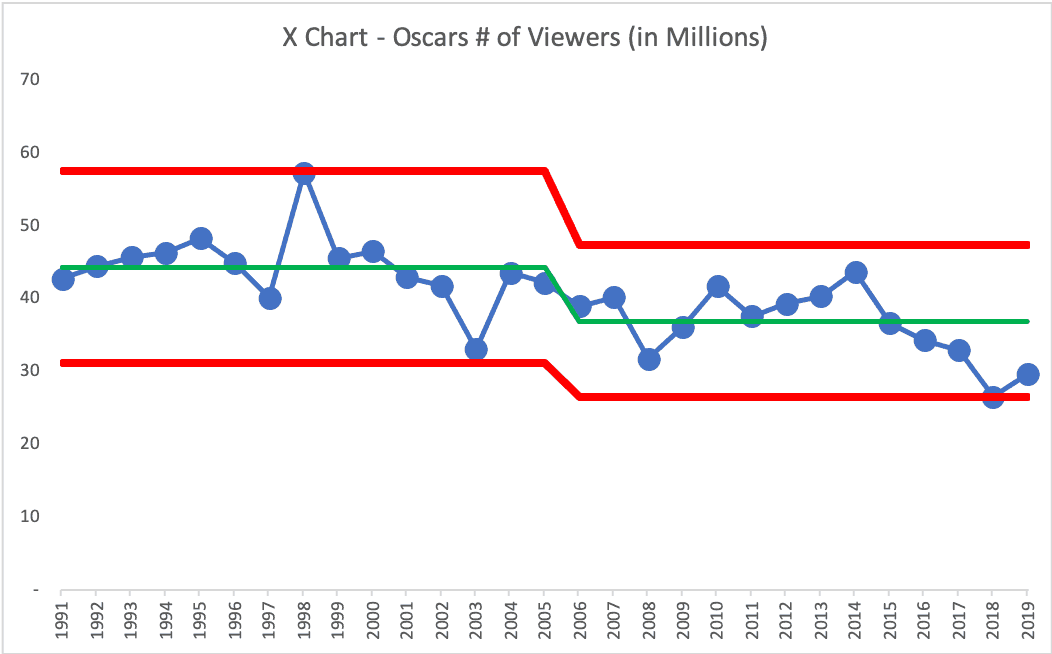
Instead of reacting to each new data point, look at trends over time using “run charts” or “Process Behavior Charts” (as I created).
Did having “no host” make any statistically significant difference in ratings? No.
The numbers have been fluctuating since an apparent downward shift in the 2000s. Don't waste time cooking up an explanation for “noise” in a metric. DO try to understand what causes meaningful outliers or shifts in the data, using the rules for finding statistical “signals.”
Should they keep the “no host” approach? That didn't really make a significant difference in the metrics. Did a shorter show help? Not really…
Year-to-year changes in Oscars ratings are often just random variation, not meaningful signals. Using Process Behavior Charts helps leaders stop overreacting to noise and focus on trends that actually matter.
Related Posts About The Oscars

The Oscars may report a “four-year high” (or now, in 2026, a “four-year low”), but the long-term data tells a very different…

tl;dr: Oscars ratings keep hitting “all-time lows,” but those single-year drops don't mean much without context. A Process Behavior Chart…

tl;dr: Year-to-year changes in Oscars TV ratings are usually just noise, not meaningful signals. Blaming or praising the host (or lack of one) based…

As I blogged about yesterday, things went well at the Oscars… or, at least, no errors were made in the announcements. But that thing that didn't go…

Tomorrow, my post will be about headlines that scream about ratings for The Oscars being “down from last year” or “the lowest in X years.” As I've…
Today's Post in <50 words: Lean thinkers don't blame individuals who are in a bad system, whether that's a presenter at Oscars, a kicker in a…


Hello Mark! I enjoy reading your blogs on measurement. Yet few questions have been in mind for a while now. What kind of data one can put into process behavior chart? Is there any characteristics for data that must be considered? What about different types of control charts? Have you written any blogs on those topics or does your new book cover the questions? Thanks.
Some discussion on LinkedIn: