


Home runs are soaring in Major League Baseball–and not just in highlight reels. The numbers show a dramatic increase, raising eyebrows and sparking questions. Is it just a blip or part of a bigger trend? As someone who spends a lot of time helping organizations interpret performance metrics, I couldn't resist taking a data-driven look at what's happening in America's pastime.
I recently had the opportunity to attend a Philadelphia Phillies game Tuesday night with college friends I hadn't seen in over 20 years, so that's where I took the photo that you see as the “cover image” for this post.
We saw a total of four home runs at the game, which is greater than the average number of homers hit per game in Major League Baseball this year (3228 home runs divided by 2372 times 2 teams per game = 2.72 home runs per game total).
If you follow my work, you might agree that a single “above average” data point isn't worth overreacting to.
The 1.36 homers per team per game is the highest ever in MLB history (see the stats). Every data set (or business metric) has a point that represents the “highest number ever” — but that doesn't mean the highest number is a statistical outlier.
If you know my book Measures of Success, you might know my advocacy for “Process Behavior Charts” as a way to separate signal from noise in our data (a lesson that comes from Walter Shewhart, W. Edwards Deming, and Don Wheeler).
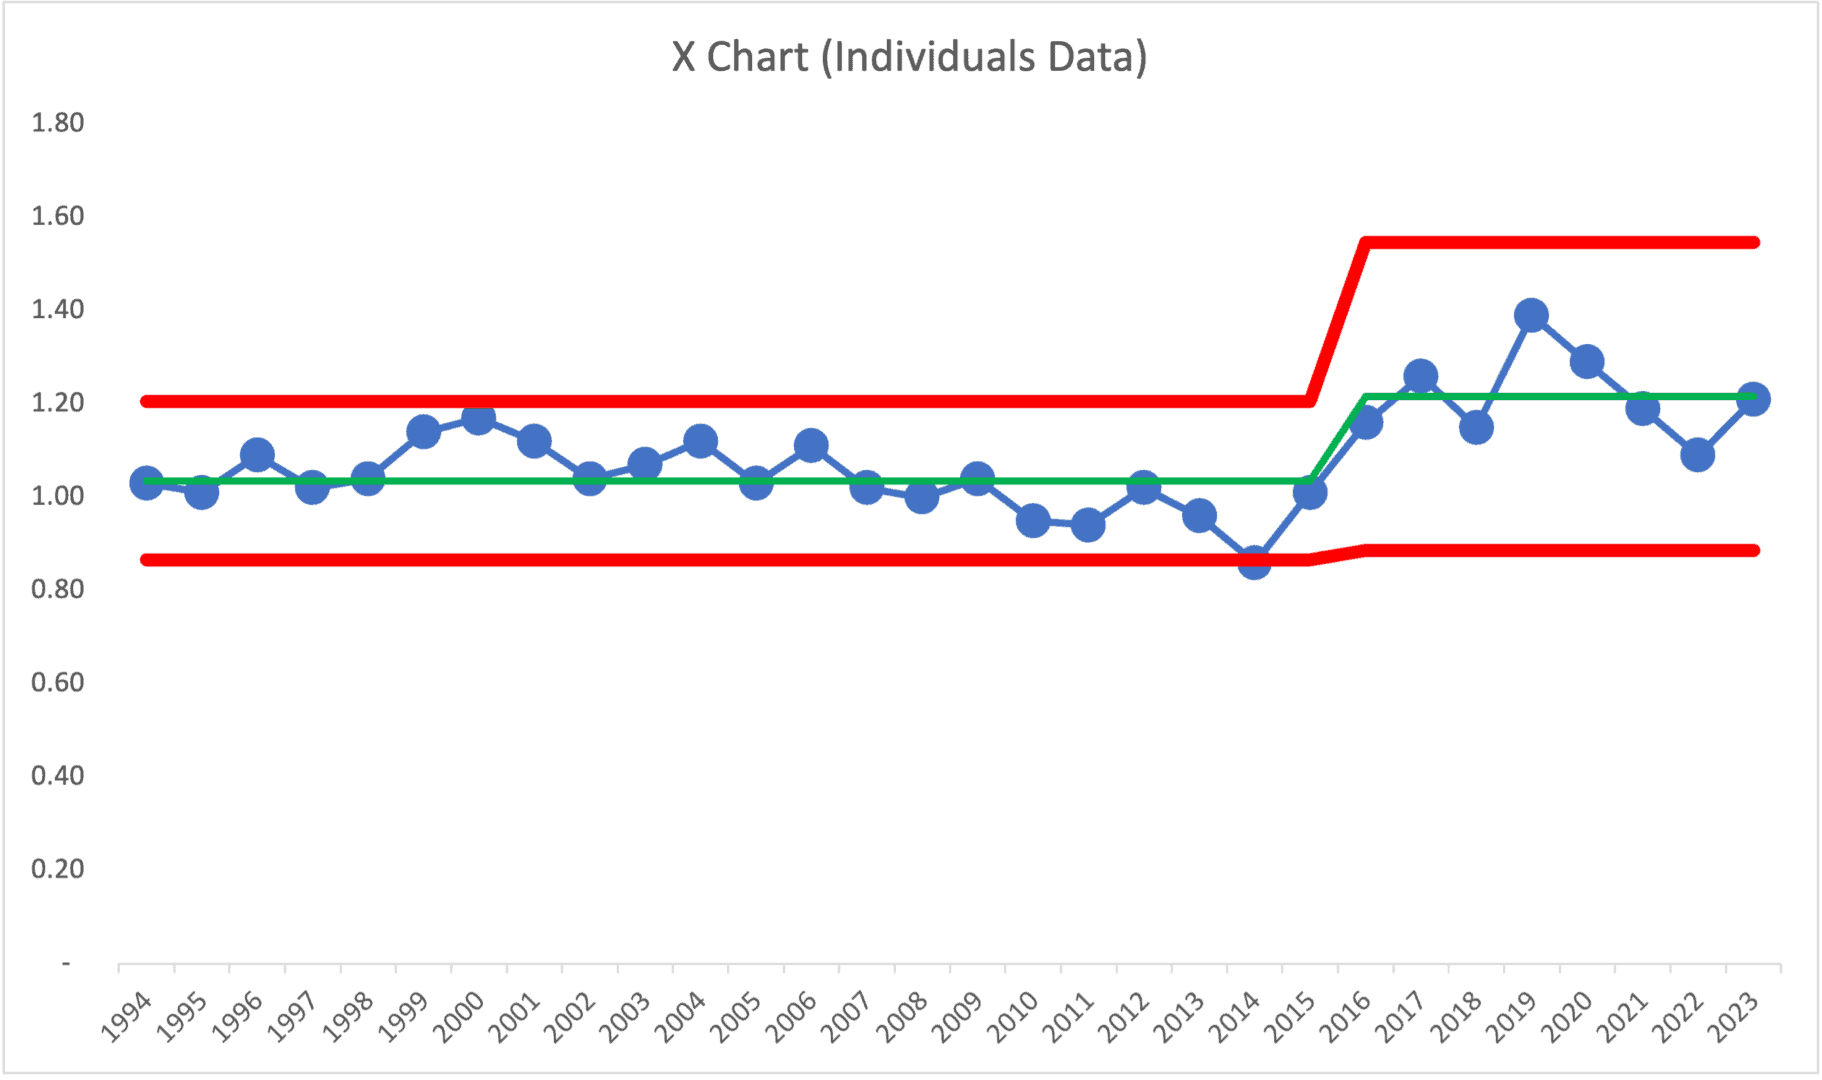
A PBC for home runs per game per team over the last 25 years looks like this:
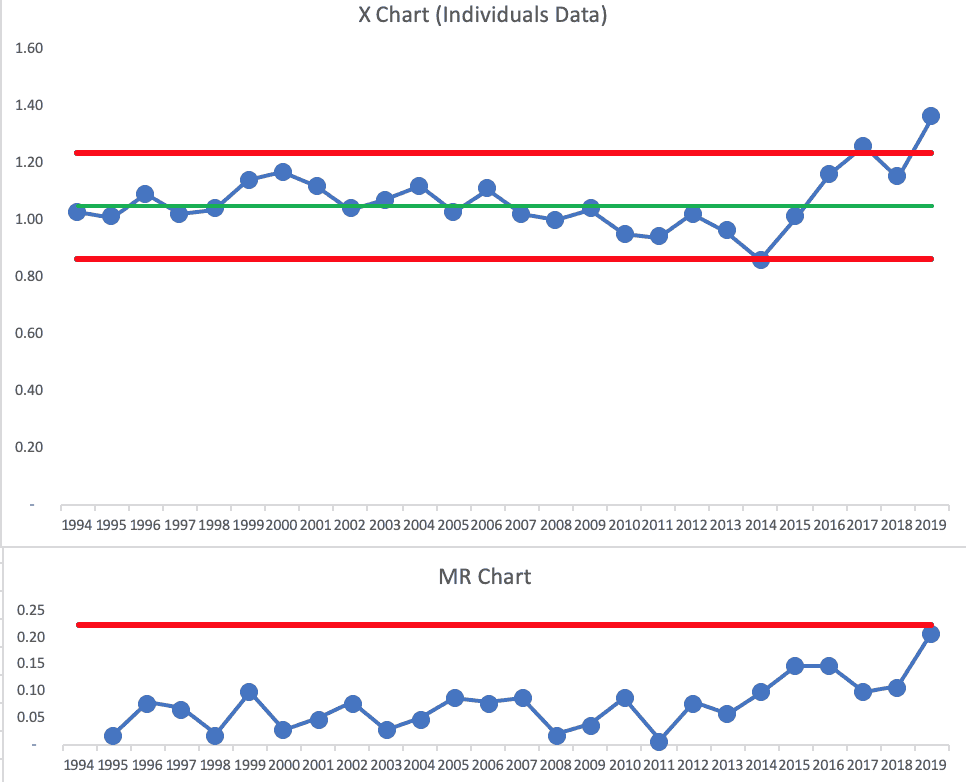
The X Chart shows that the number fluctuated pretty randomly from 1994 to 2006 (the Mark McGwire / Sammy Sosa chase-for-61 season wasn't an outlier). Then, we see eight below-average years from 2007 to 2015 (a statistical signal that something has changed in the baseball “system”) and we that 2014 was a signal in that the home runs per game was below the calculated Lower Natural Process Limit.
We'd be right to ask, “What was different in the game those years?”
Then, something changed again, as we see that the 2017 and 2019 seasons both have home run rates that are above the Upper Natural Process Limit. And we see four consecutive data points that are closer to the Upper Limit than they are to the average.
The swing down and the swing up are NOT likely to be random fluctuation.
So, what has changed in the game the past few years??
There are many theories, including:
- Pitchers throw harder, leading to harder hit balls
- Batters are focusing on “launch angle” and hitting the ball up
- Batters focus more on home runs and accept that strikeouts are OK
- The seams on the baseball are lower or tighter, making the pitches spin less and making the ball carry further when hit
- The ball is “juiced” or more bouncy, making it carry further
It's a waste of time to ask why a data point is up or down when those data points represent noise or routine variation in the metric. For example, it wouldn't be worth the effort to ask, “Why was 2006 higher than 2005?” Sometimes a metric just fluctuates when we have a stable system.
Don't overreact to noise… DO ask why there is a signal in a metric.
The point of Process Behavior Charts isn't to create pretty or technically-correct charts. The charts help us:
- Avoid overreacting and wasting time and energy
- Help us improve by pointing us to times when we should better understand cause-and-effect relationships in our system
If we intentionally made a change, we can use PBCs to help validate a hypothesis about improvement (did the metric change in a non-random significant way?). And, PBCs can help us understand when something has changed (and we should investigate to figure out why).
Recently, MLB put out a statement explaining why home runs are up so dramatically:
The balls aren't juiced: MLB explains rise in home runs
“[Rawlings] hasn't changed their process in any meaningful way,” Manfred said Thursday at the end of the owners' meetings. “They haven't changed their materials.”
But, Commissioner Manfred contradicts himself… Rawlings might be using the same equipment and the same materials, but their process has changed in that the quality is more consistent in the baseballs:
“Manfred cited last year's report, written by a committee of scientists and data specialists, which identified the pill at the center of the ball playing a factor. If the pill is not perfectly centered, the ball wobbles when hit and creates more drag.
“We think one of the things that may be happening is they're getting better at centering the pill, [which] creates less drag…” [which means the ball flies further]
I'd argue that Rawlings HAS found a way to improve their process… the reduced variation in the “pill placement” is arguably the “special cause” of the higher variation in the number of home runs being hit.
The old definition of quality is based on specification limits. An MLB ball has specs that include:
“Under the current rules, a major league baseball weighs between 5 and 5 1⁄4 ounces (142 and 149 g), and is 9 to 9 1⁄4inches (229-235 mm) in circumference (2 7⁄8-3 in or 73-76 mm in diameter).”
I don't know if there's a “pill centering” spec.
But the old definition of quality is binary — good or bad. A ball that's 142 g in weight is considered to be equally as good as a ball that's 149 g in weight, or one that's in the middle at 145.5 g. They're all in spec.
But, the now-famous “Taguchi loss function” says that quality declines as you get further from the center of the spec range. The goal then is to reduce variation and have as many products be right at the center of spec range or as close to it as possible.
This article shares the classic illustration that compares the traditional specifications view to the Taguchi view:
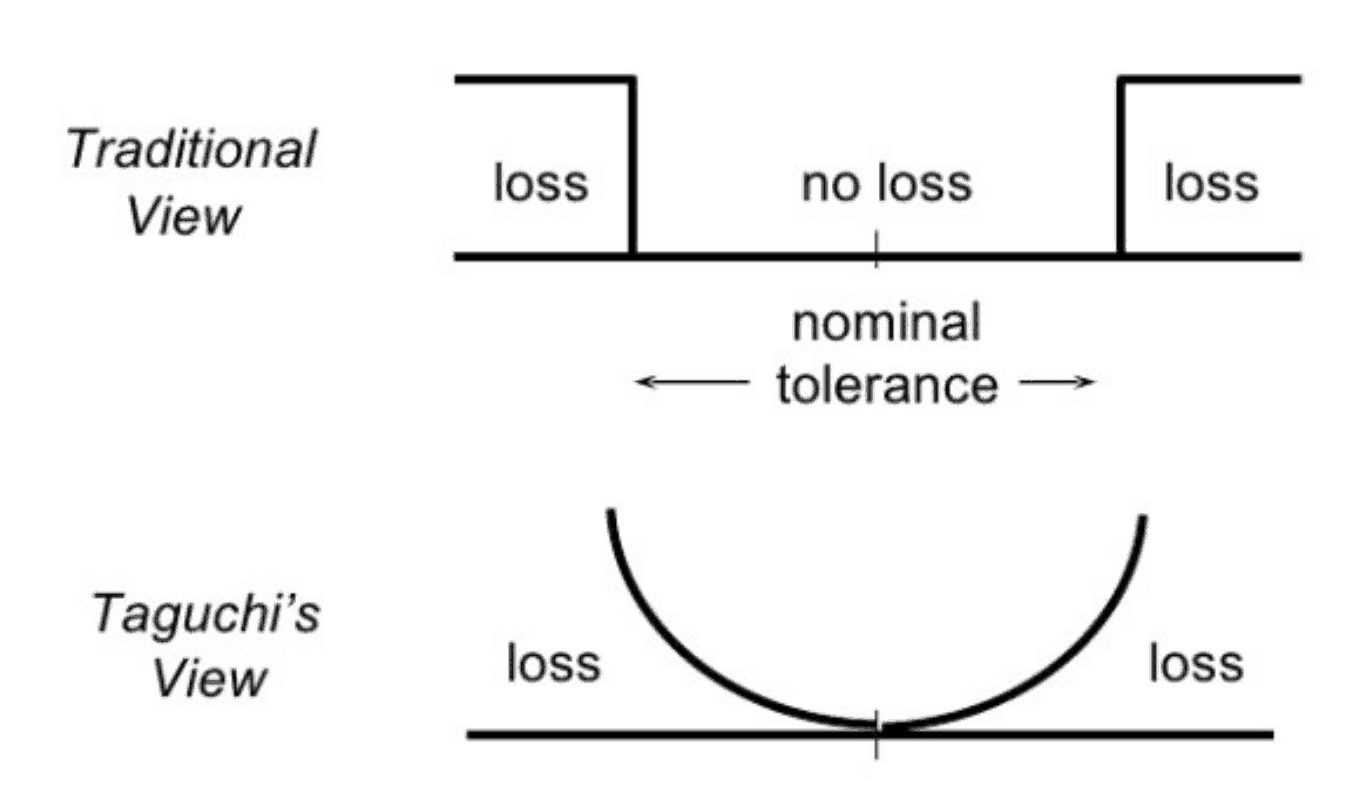
Baseballs with weight, size, or pill centering that's further from the center or nominal value are “worse quality.”
Maybe somebody at Rawlings understands that view of quality (one that's shared by Toyota and many Lean manufacturers). Maybe they've taken it upon themselves to produce baseballs that have less variation and are closer to “nominal” pill centering, not just all “in spec.”
And look at the surprising side effect that seems to have in MLB, creating a game with more home runs, and a game that some (including ESPN's Tim Kurkjian) think is less fun to watch because the focus on home runs, strikeouts, and walks has led to a three-hour game with less action and more “dead time” between balls being put in play.
So, to recap… the Process Behavior Chart tells us something has changed in our metric, which means something has changed in the system. For this, or for any workplace metric, the PBC tells us when to go investigate and better understand our system. It doesn't tell us what has changed or why so that's our job to figure it out.
Here is an updated X Chart that includes the 2020 season:
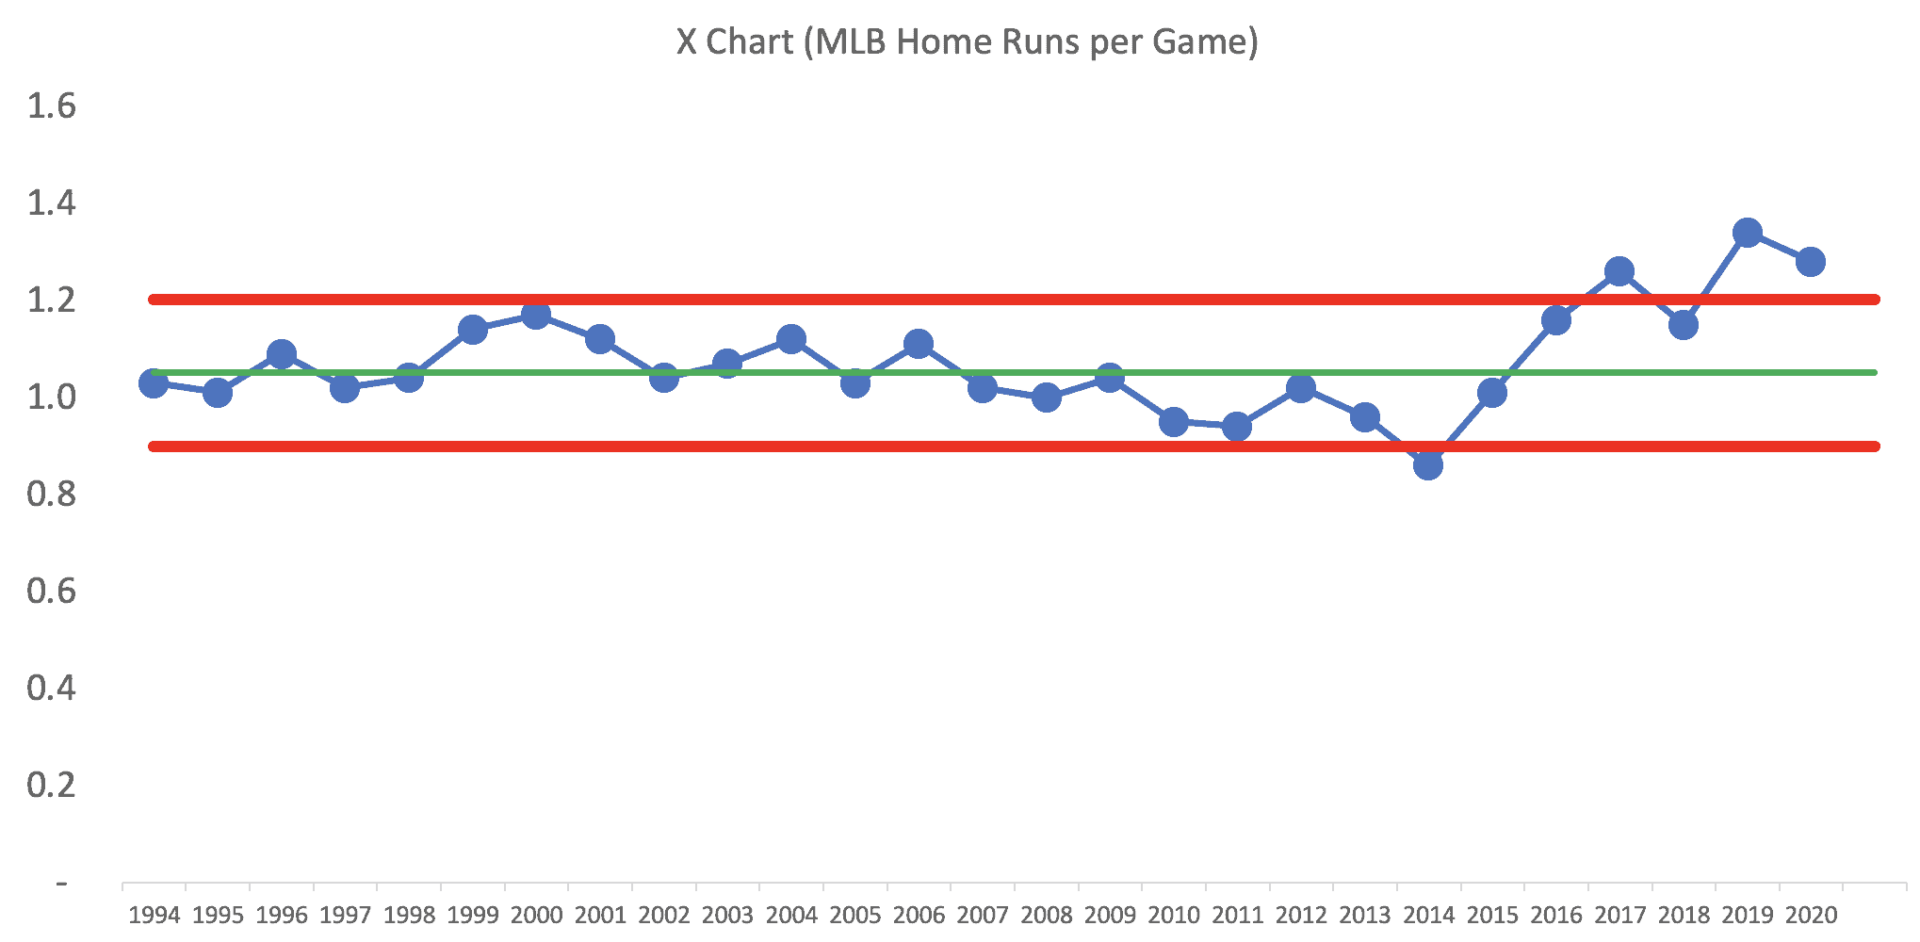
It looks like Home Runs per Game has been fluctuating around a higher average the past five years. The average is higher and there's more year-to-year variation, so the limits are wider:
If next season is within those limits, it might be evidence that the change in the ball isn't that meaningful. But we'll see what the data tells us.
When we see data that signals a shift–whether it's in a hospital's patient flow, a factory's defect rate, or baseball's home run frequency–it's our cue to get curious. Process Behavior Charts don't tell us exactly why something changed, but they do help us see that something has. That's our starting point for investigation and learning.
Whether you're managing a team or managing a bullpen, remember: reacting to noise wastes energy. Responding to signals? That's how we improve.
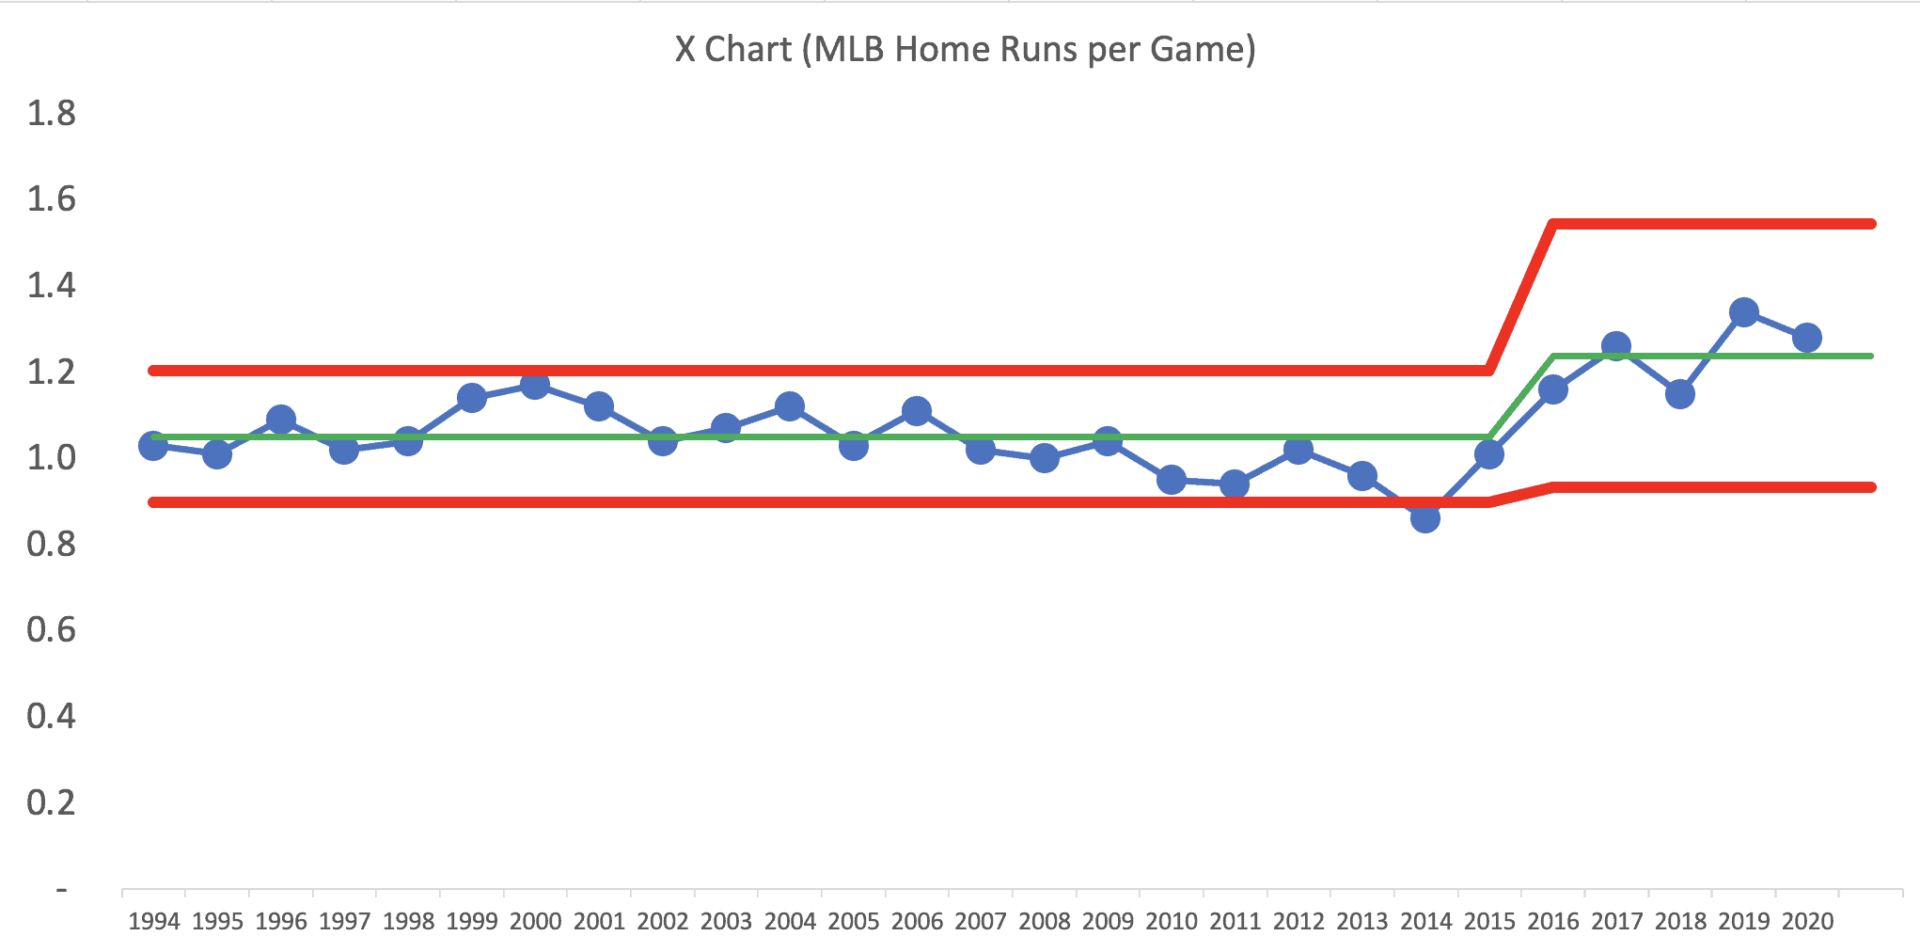
Update: The Chart Including the 2023 Season
I'd say there's definitely a shift update that started in 2016, as we now have 8 consecutive seasons above the baseline average:
Please scroll down (or click) to post a comment. Connect with me on LinkedIn.
Let’s work together to build a culture of continuous improvement and psychological safety. If you're a leader looking to create lasting change—not just projects—I help organizations:
- Engage people at all levels in sustainable improvement
- Shift from fear of mistakes to learning from them
- Apply Lean thinking in practical, people-centered ways
Interested in coaching or a keynote talk? Let’s start a conversation.


I just heard the Commissioner talking about this on the ESPN broadcast of the 2nd game from the London series.
He talked about the “team of scientists” who are “continually looking at” the baseballs… “they are a hand made product” so there is going to be variation, sometimes year to year.
He talked about the pill centering and said there are different theories about why the ball is “low drag” and he said the pill centering might not be the only factor.
In the news:
“M.L.B. Will Change Its Baseballs After Record Home Run Rates”
The intent is a ball that doesn’t fly quite as far. We’ll see if there’s a reduction in home runs next season.
It goes to show that “in spec” and “centered in the spec” aren’t the same thing.