Search Results for don wheeler

Stop Overreacting to Metrics: Lessons from Lean Startup Week

Thanks to Eric Ries and the organizers for Lean Startup Week for allowing me to share video of my 15-minute talk from last year's event.

One reason for sharing this today is to celebrate yesterday's initial release of the in-progress version of my book Measures of Success. If you buy the book now, you'll get a PDF of the first three chapters, or about 40% of the book's expected content.

Ratings for “The Oscars” Were Lower in 2018? Should We Ask Why or Look for Longer-Term Trends?

Downward trending line graphic over gold trophy figures representing decline in success or performance.

As I blogged about yesterday, things went well at the Oscars... or, at least, no errors were made in the announcements. But that thing that didn't go well was the TV ratings.

Two Data Points Are Not a Trend
The headlines I saw had a lot of two-data-point comparisons. Headlines sometimes gave the percentage decrease in viewers or how many million fewer viewers there were. Many talked about "record low" but if you're tracking a metric "record low" or "all-time high" doesn't mean there's a "special cause." That "record low" could still be noise in the system.

Every Metric Has Variation – What Can We Learn from NCAA Football Attendance?

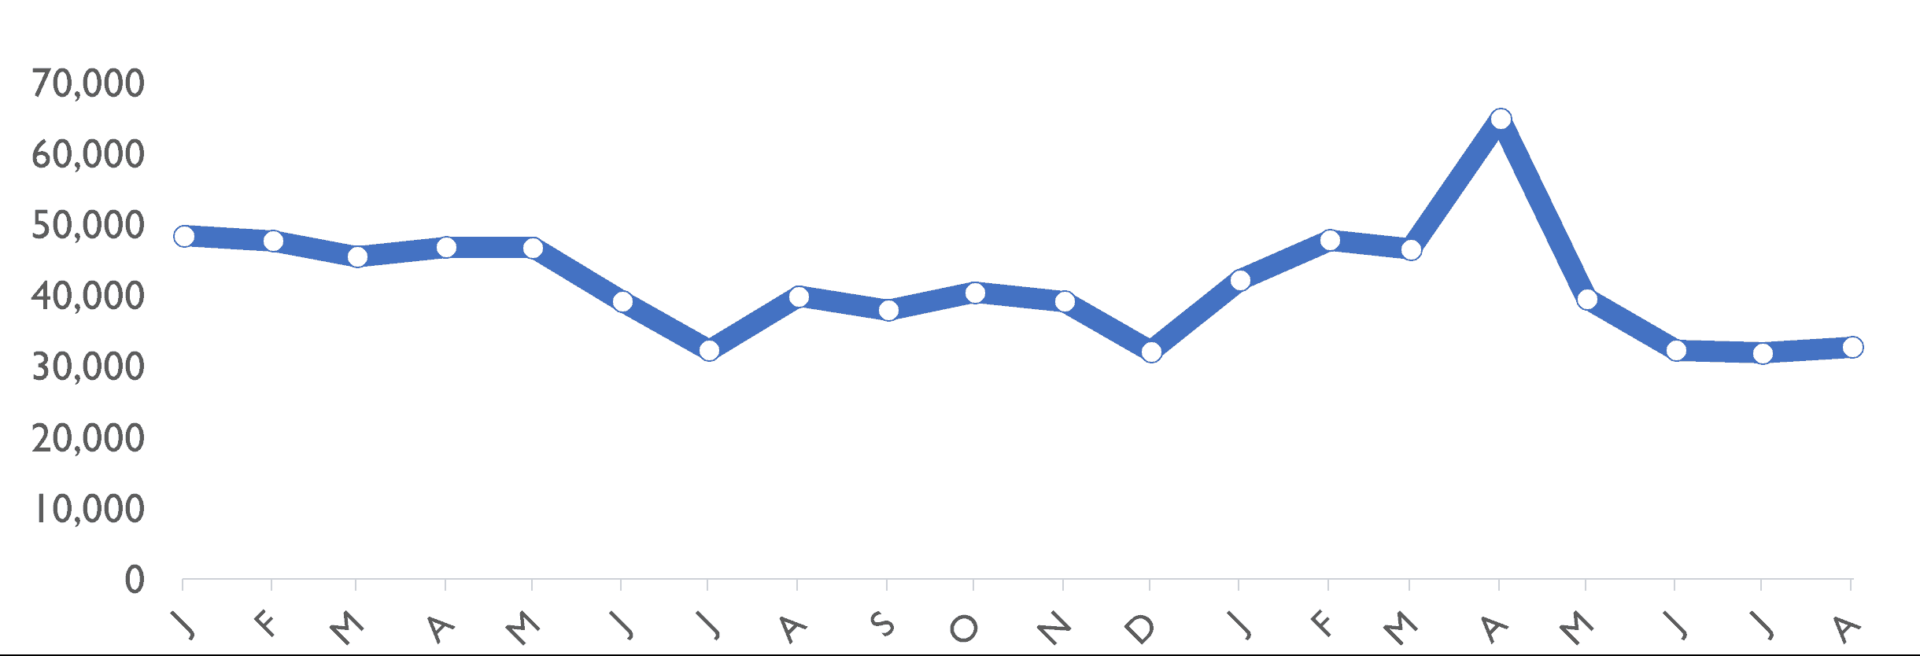
football attendance analysis chart

Last week, I saw a headline about a drop in NCAA college football attendance.

I wasn't satisfied with the two data point comparisons or other written descriptions of the metrics. I wanted to see data. SHOW ME THE DATA, JERRY! (with apologies to "Jerry Maguire"). I wanted to see a chart. So, I found the data on to NCAA website and created "process behavior charts" that tell you much more about the data than text numbers ever could.