

The Book That Changed Me: Understanding Variation by Donald J. Wheeler
TL;DR: Understanding Variation by Donald J. Wheeler is the most influential book in my Lean journey. It taught me how to distinguish signal from noise in data, avoid overreacting to normal variation, and focus leaders on improving systems instead of blaming people. Those lessons directly shaped my later work, including Measures of Success, for which Don graciously wrote the foreword.
For my latest “LinkedIn Influencer” post, I was asked to participate in a series about “The Book that Changed Me.”

I chose to highlight not a book about Toyota or Lean or a book by Dr. W. Edwards Deming… but rather the amazing book Understanding Variation: The Key to Managing Chaos by Professor Donald J. Wheeler.
Get the book. Read it. Study it. Use it. It's that good. It's that helpful.
It's a wonderfully powerful book… basically, it's all about how to use “Statistical Process Control” (SPC) principles (a.k.a. “Process Behavior Charts”) to make better management decisions.
Check out my LinkedIn article here: “Understanding Variation”: How I Learned to Ignore the Noise in Data and Focus on Fixes. The full text of the article can also be found below, as well.

And here's a link to the book itself…
“Understanding Variation”: How I Learned to Ignore the Noise in Data and Focus on Fixes
This post is part of a series in which Influencers describe the books that changed them.
Those who follow my blog or my books might have guessed the book that changed me would have the words “lean” or “Toyota” in the title. Or, you might have guessed that a work by the late quality guru W. Edwards Deming would get that honor.
If you guessed Deming, you'd be close. The book that changed me, the most influential in my work and career, is Understanding Variation: The Key to Managing Chaos, by Donald J. Wheeler. I've read the book many times, given countless copies away, and I've found the lessons and practices in the book to be invaluable to me and my clients.
Dr. Wheeler builds upon the work of Dr. Deming by cogently explaining the use of “statistical process control” (SPC) methods that allow us to make better decisions as managers. SPC has traditionally been applied to help reduce variation and improve quality in manufacturing processes, including in my first job at General Motors, but the principles and ideas should be used in healthcare, startups, government, and other settings.
Some of the key lessons from the book:
1) “No data have meaning apart from their context”
Too many organizations post and share data that have no real meaning for employees or customers. One example of data lacking context was something I saw a few years back, posted in a hospital's main lobby:

For one, I guarantee that most patients (and probably most staff) have no idea what a “quality panel score” is and what it means for their care. The YTD number was 3.58. Is that good? Is that on a 4-point scale or out of 10? Why is the target 3.59? Isn't the actual suspiciously close to the target? Why is this?
One might applaud the hospital for being transparent with its data, but transparency isn't very helpful if what's being shared is actually confusing or opaque.
2) Two data points do not make a trend
Dr. Wheeler also highlights the problems that occur when we look at just two data points, whether it's an actual vs. target comparison, as seen above, or a comparison between any two data points over time.
Looking at any two data points can lead to faulty conclusions and, therefore, bad management decisions. We see this happen in organizational metrics, consulting case studies, and even in the news.
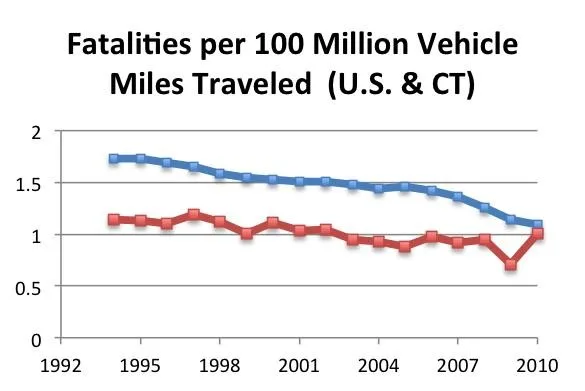
An article from 2011 stated there was a “jump” in traffic fatalities by comparing just two data points – from 2009 to 2010. Connecticut showed a 42% increase in fatalities from one year to the next. But, do the data imply that the roads in that state suddenly became 42% more dangerous? This seems very unlikely.
When you actually examine the data, for the US as a whole (red line) and Connecticut (blue), the chart, below, makes it clear that roads are actually getting safer over time. The fatality rate in Connecticut was only slightly higher than two years ago (2008). Maybe the low 2009 data point was the aberration – possibly due to some problem in reporting the data? There should have been a news story 12 months earlier that stated how safe the roads were getting.
3) Don't rely on tables of numbers
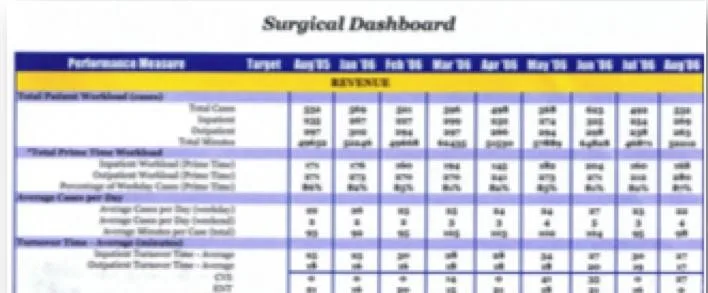
Wheeler also teaches that people are not very good at interpreting tables of numbers, whether it's a simple management report that shows this year vs. last or a dense series of numbers. Below is part of a management “dashboard” from a hospital (data intentionally blurred). Does your car's dashboard display this much data or in this format? Thankfully, not.
Even if you could read the numbers in the table, it's much easier to see trends in a simple “run chart,” as shown below, from a consulting case study about improving patient satisfaction.
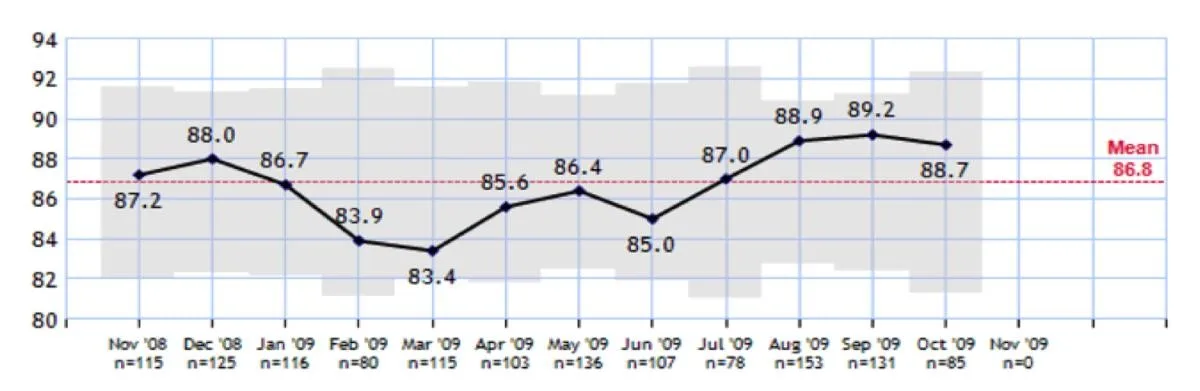
The consulting case study cherry-picked just the November 2008 and October 2009 data points to claim that “The average patient satisfaction increased from 87.2 to 89%.” Was this a statistically significant improvement?
Here is a data table that I generated from the case study:

It's really hard to draw good conclusions from the table. We can see the last data point is higher than the first, but that's about it. The chart makes it easier to see what's happening over time, but harder to prove if there was a meaningful improvement or not.
4) Understand “common cause” vs. “special cause” variation
A more formal method explained well by Wheeler in the book is the application of “statistical process control” methods to see when a data point is “out of control.”
In the previous chart, the “increase” could just be “noise in the system” or a fluctuation that results from a stable system.
Drawing an SPC chart, as shown below, with a statistically calculated “lower control limit” (LCL) and an “upper control” limit (UCL) shows us that the claimed “increase” is really just noise in the system and is likely due to what we'd call “common cause variation.”
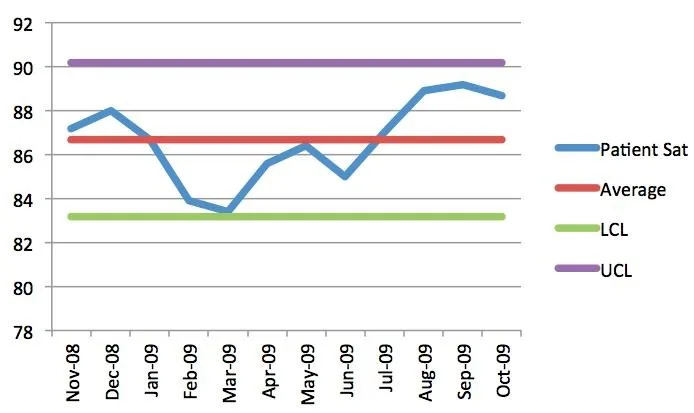
A single data point below 83.1% (the LCL) or a single data point above 90.2% (the UCL) would indicate that there is an “assignable cause” (aka “special cause”) that we could attribute that data point to. There are also more rules (the “Western Electric rules“) that allow you to determine if there is a statistically valid shift or change in the system – signal, rather than just noise. For example, if the US roadway fatality rate declined for eight consecutive years, that would indicate an assignable cause rather than it just being random noise.
As managers, we might draw bad conclusions or we might waste time searching for a “special cause” that does not exist (since the change in the data is just noise). This is probably the most helpful lesson from Dr. Wheeler's work – don't waste time chasing noise – work to improve the underlying system instead.
This might seem a bit esoteric or a little hard to understand given space constraints. Please check out Don Wheeler's book and work for a better explanation of these principles that have been so helpful in my work. I hope you'll read the book, that you'll find it useful, and that you'll let me know how you've used these concepts.
You can also view a recorded webinar that I did on this subject, with slides that show how to draw an SPC chart.
Update: Dr. Wheeler wrote the foreword to my book Measures of Success, which takes a deeper dive into this topic.
Why Understanding Variation Still Matters Today
More than a decade after I first wrote this post, the lessons from Understanding Variation feel even more relevant. In many organizations, leaders still react to every up-and-down in metrics, mistake noise for signals, and unintentionally create fear, blame, and wasted effort. Dashboards have gotten fancier, but the underlying thinking often hasn't improved.
What Donald J. Wheeler teaches–building on Deming's work–isn't about statistics for their own sake. It's about better management. It's about knowing when not to react, when to ask better questions, and when the real work is to improve the system rather than interrogate people.
That mindset directly shaped my later book, Measures of Success, which takes these ideas further for leaders who want to react less, lead better, and create environments where learning is possible. When leaders understand variation, they make better decisions, cultivate psychological safety, and focus improvement efforts where they actually matter.
If you're leading in healthcare, manufacturing, startups, or any form of knowledge work–and you're serious about continuous improvement–this is still foundational thinking. Fewer fire drills. Better conversations. Better systems. That's why this book, and this message, still matter.


Hi Mark
Is this book applicable to Knowledge/Discovery work?
Thanks
Agustin
I think the book is applicable to every type of work…
Hi Mark
This is a great little book and one that I recommend all the time. Despite being a Professor of Statistics (or maybe because?), Don Wheeler writes superbly and carries you along at a nice pace without overwhelming you with technical detail. A must read for any aspiring quality improvement professional.