Search Results for process behavior chart

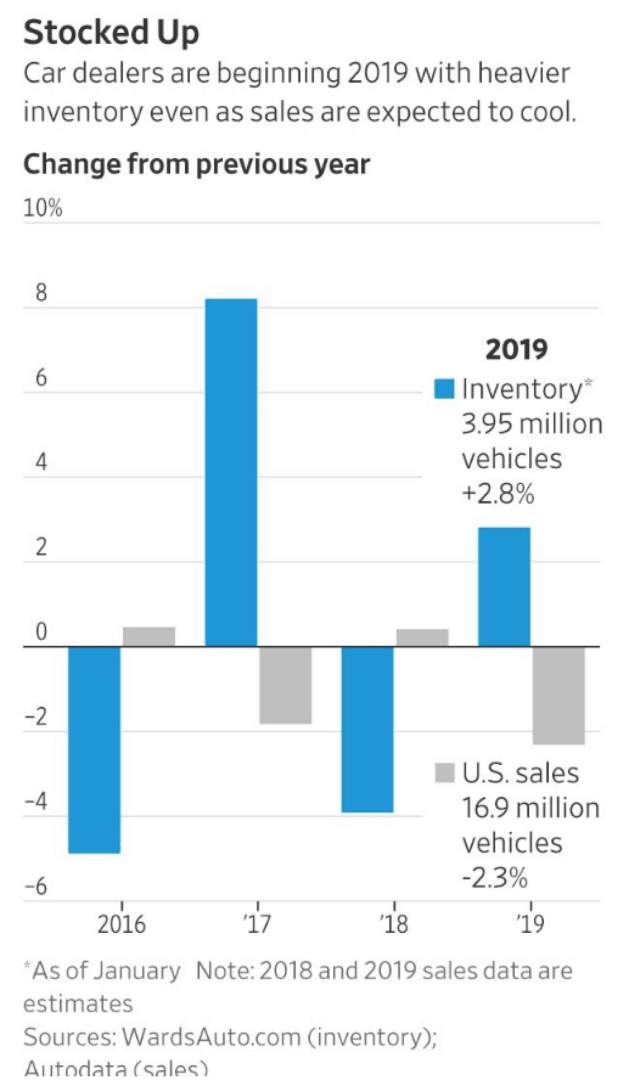
Why Year-Over-Year Charts Often Mislead Leaders

TL;DR: Year-over-year charts look analytical, but they often hide routine variation and invite overreaction. Process Behavior Charts make real improvement–and real risk–visible without guesswork. The main subject of my book Measures of Success is “Process Behavior Charts” (see more in…

Look Out! That ‘Out of Control’ Chart Might Not Be What You Think

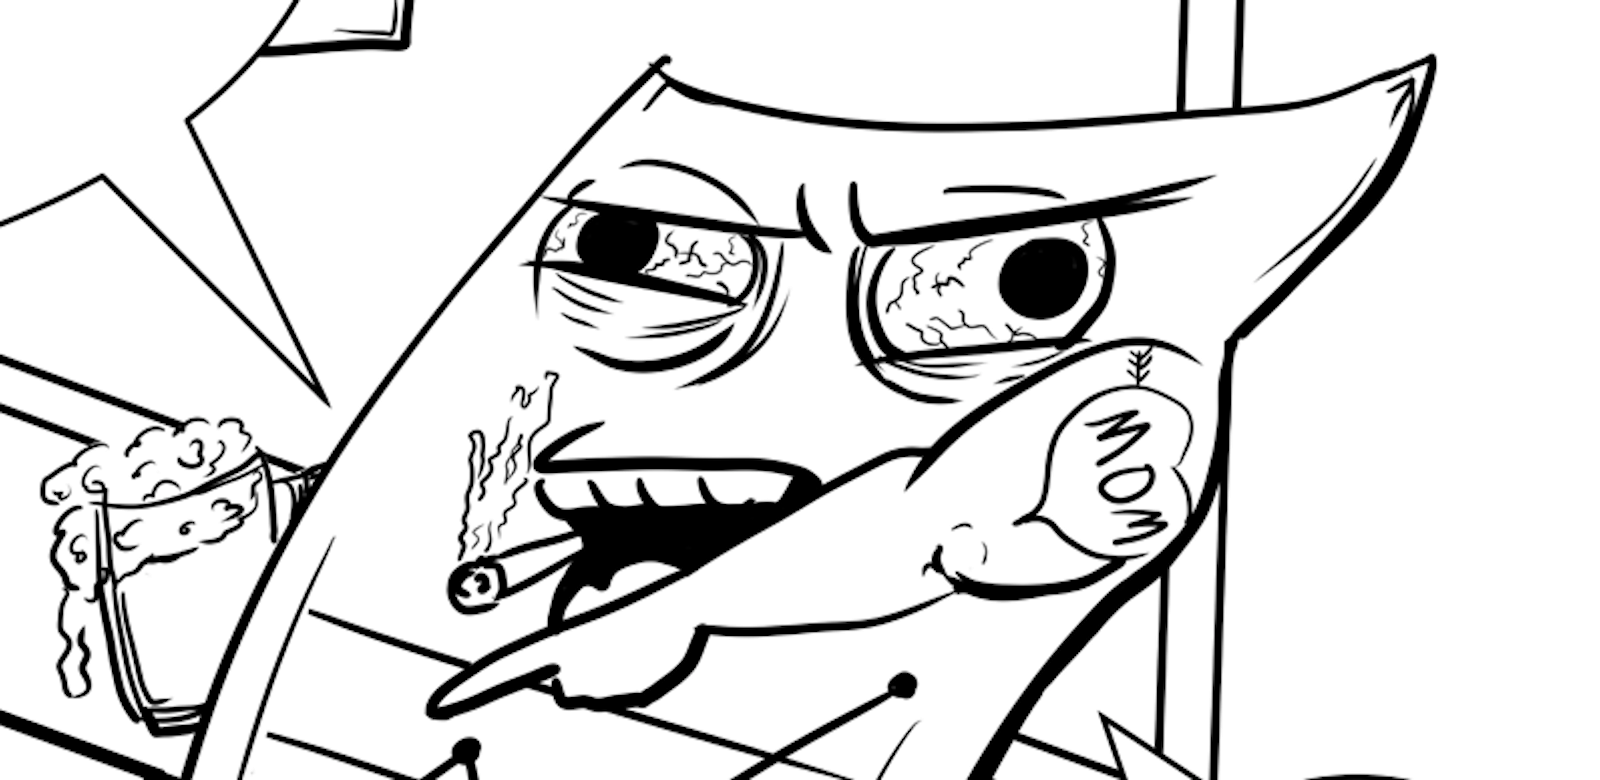
Here's the latest cartoon collaboration with a skilled artist and medical assistant, Carrie Schurman (see past cartoons). You can find her on Twitter as @carrieschurman.

The idea for this cartoon came from Maggie Millard, the director of marketing at KaiNexus. Maggie has learned about Process Behavior Charts from me and some of the stories are incorporated into my book Measures of Success. 

What does this "out of control chart" look like and why did it make me chuckle?

A Stomach Bug, the Emergency Room “Gemba,” and Charts, Charts, Charts

Here's a reprieve from posts about my new book Measures of Success: React Less, Lead Better, Improve More. Although I will mention that the book should be available very soon in the Apple iBooks store. And today's post is on themes from the book.

Unfortunately, I've had two trips to the emergency room within the past year, due to stomach flu problems. Or, it was possible food poisoning. In cases like these, the doctors aren't really worried about the exact root cause, because the treatment is the same either way. They're treating symptoms.

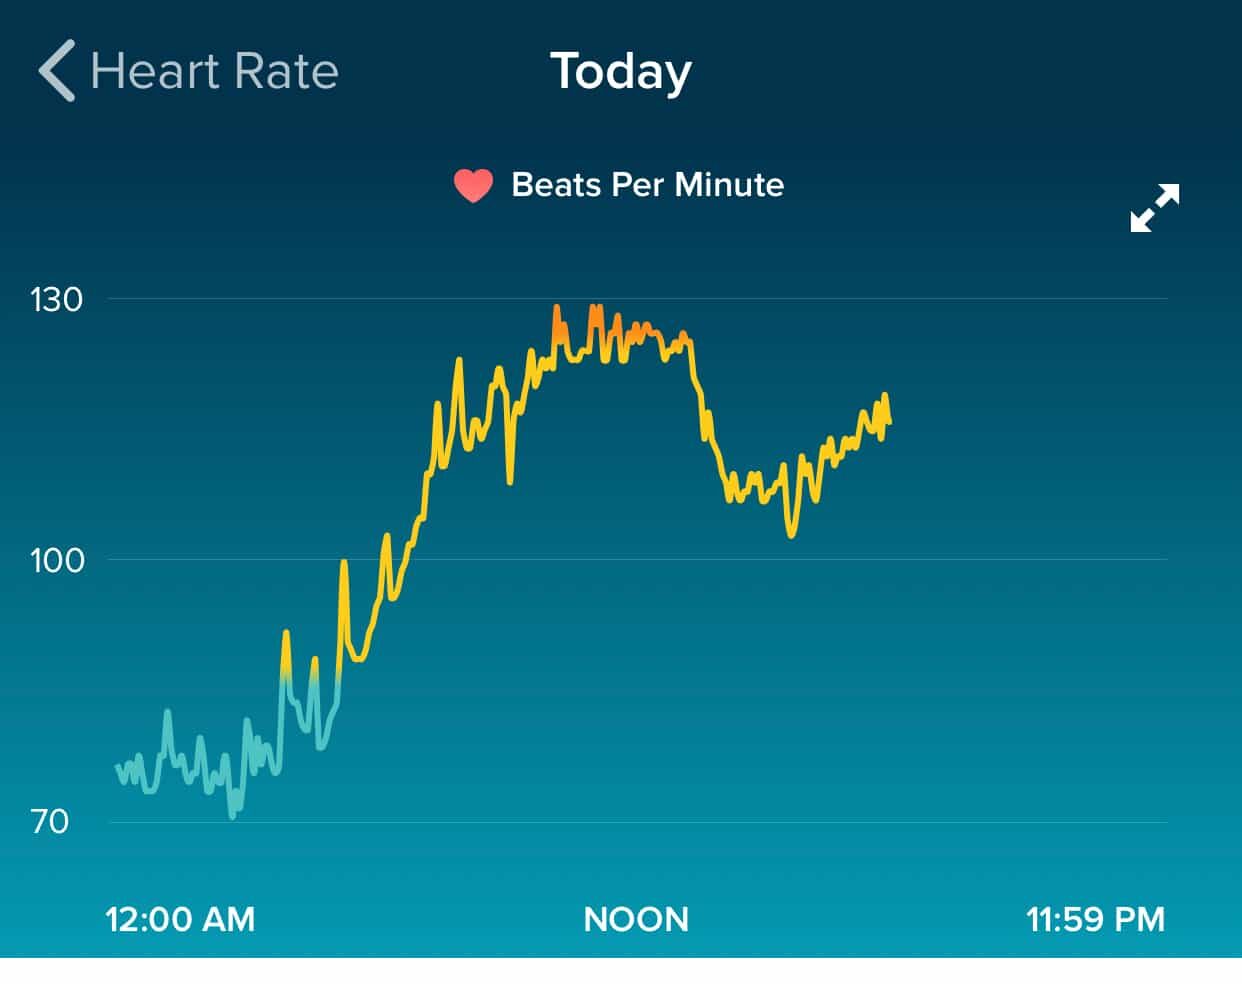
Last Wednesday morning, I woke up early and I was sick. Stomach issues. Fever. I noticed on my Fitbit that my heart rate was elevated above normal levels. I was working from home that day, so I stayed in bed, slept, and rested. I wasn't really able to eat anything and it was hard to get liquids down...