
Recording of My “Measures of Success” Webinar

Here is the recording of the webinar I told you about recently, with themes from my book Measures of Success.
What is "management by emoji?"

Here is the recording of the webinar I told you about recently, with themes from my book Measures of Success.
What is "management by emoji?"

Here is my latest article that I published on LinkedIn:
Is the Reported Drop in Major League Baseball Attendance a "Signal" or "Noise" in the Data?

I'm still working on my book Measures of Success, as I've mentioned here a few times.
The partial "in-progress" book is available through LeanPub.com. Or, when it's done, it will also be available through the Amazon Kindle bookstore and I will probably also produce a paperback version.
My goal is to have the book done by the Lean Healthcare Transformation Summit in mid-June (hope to see you there at the Summit and/or my workshop on these topics).
Here is a recorded webinar that I did for my friend Mike Stoecklein and his organization, the Institute for Excellence (IEX).
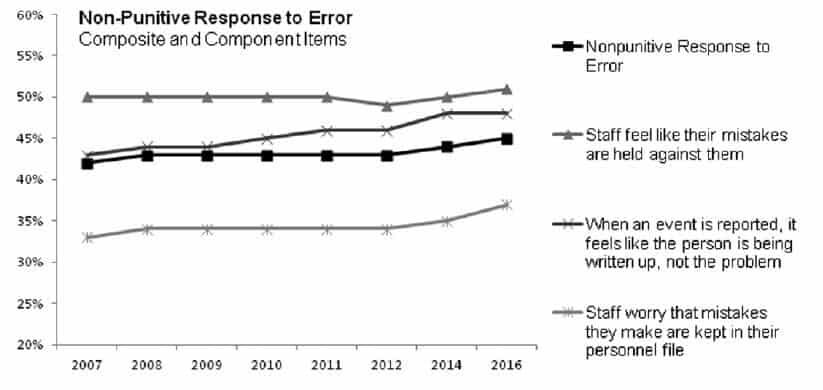
For a long time, I've been an advocate for the parallels between Lean and an approach called "Just Culture." See previous blog posts on this topic. Here's a good overview of Just Culture, which says, in part:
"A just culture recognizes that individual practitioners should not be held accountable for system failings over which they have no control. A just culture also recognizes that many individual or active errors represent predictable interactions between human operators and the system in which they work.
However, in contrast to a culture that touts no blame as its governing principle, a just culture does not tolerate conscious disregard of clear risks to patients or gross misconduct, such as falsifying a record, performing professional duties while intoxicated, etc."

I'll be teaching my "Better Metrics" workshop (aka "Measures of Success," ala my book) twice in June:
Cambridge Investments - Open for Public Registration (Fairfield, Iowa) -- June 5
Lean Healthcare Transformation Summit (Chicago) -- June 13
After facilitating the Red Bead Experiment in the workshop, one other way I've found to simulate variation is an online simulation that's available, of all places, on the BBC website:
"Can chance make you a killer?"

Last week, I wrote Part 1 of this piece about TQM and "Small Kaizen" at a Japanese Hospital pharmacy.
The hospital was happy that employees were participating in their "Small Kaizen" process, but there was a month in which they saw the number of submitted Kaizens drop, from about 138 to 58 or so.
As I write about in Measures of Success, two data points usually don't make a trend.

Thanks to Eric Ries and the organizers for Lean Startup Week for allowing me to share video of my 15-minute talk from last year's event.
One reason for sharing this today is to celebrate yesterday's initial release of the in-progress version of my book Measures of Success. If you buy the book now, you'll get a PDF of the first three chapters, or about 40% of the book's expected content.

Today, I’m giving a keynote talk at the Lean & Six Sigma World Conference being held in Las Vegas. I don’t normally attend or speak at “Lean Sigma” events, but I had an opportunity to give a new talk that touches on two of my favorite themes in recent years – the need to apply statistics and psychology to our “Lean Management” practices or Six Sigma or whatever.
Are minor league games taking longer? Well, yes and no, depending on the league.
My next book, Measures of Success, is about the use of this Process Behavior Chart methodology in the workplace, as applied to our performance measures.
This post explores some data, how asking for more data can be more helpful, and how to use charts to evaluate a metric over time.

As I blogged about yesterday, things went well at the Oscars... or, at least, no errors were made in the announcements. But that thing that didn't go well was the TV ratings.
Two Data Points Are Not a Trend
The headlines I saw had a lot of two-data-point comparisons. Headlines sometimes gave the percentage decrease in viewers or how many million fewer viewers there were. Many talked about "record low" but if you're tracking a metric "record low" or "all-time high" doesn't mean there's a "special cause." That "record low" could still be noise in the system.

Tomorrow, my post will be about headlines that scream about ratings for The Oscars being "down from last year" or "the lowest in X years." As I've blogged about before, I'm always skeptical of such simplistic comparisons that might mask the real underlying trend.
But first, could the Academy avoid last year's embarrassing mixup?

Last week, I saw a headline about a drop in NCAA college football attendance.
I wasn't satisfied with the two data point comparisons or other written descriptions of the metrics. I wanted to see data. SHOW ME THE DATA, JERRY! (with apologies to "Jerry Maguire"). I wanted to see a chart. So, I found the data on to NCAA website and created "process behavior charts" that tell you much more about the data than text numbers ever could.