

The other day, I was re-reading parts of the classic book by W. Edwards Deming, Out of the Crisis.
Chapter 11 focuses on variation, an extremely important topic, as I've written about before.
The chapter includes this chart and some discussion from Dr. Deming… before the chart, he writes:
“A program of improvement sets off with enthusiasm, exhortations, rival meetings, posters, and pledges. Quality becomes a religion.”
None of those things are recommended by Dr. Deming. We, of course, see a lot of that in healthcare today.
Leaders announce that improvement must happen, let's say a reduction in patient falls.
Dr. Deming would have asked “By what method?” What is the method for improving the system? He would have also asked, “How will we know if we have improved?”
From the initial improvement (which could be a form of the Hawthorne effect, as recently discussed in HBR related to Joint Commission inspections at hospitals), there is optimism and hope that the “continuous improvement” trend will continue (we can draw the line all the way to zero).
Why does Dr. Deming call it “wishful thinking” to think the trend would automatically continue?

By removing “special cause” problems (not the same as “low hanging fruit” necessarily), the system has been brought back to what it should have been (as Deming credits Dr. Juran for saying). Deming would have added the idea that putting a fire out is not improvement.
One we have removed the “obvious sources of improvement,” the “special cause” problems (through “horse sense,” said Deming), we're left with what is most likely a stable system with “common cause” variation.” Reducing common cause variation means improving the system, which requires a certain amount of skill and a methodology (like Lean, I'd suggest). Dr. Deming suggested a “program of action on the 14 points and removal of deadly diseases and obstacles, led by management” will lead to “the curve for improvement of quality and productivity does not level off. Improvement continues so long as the management leads the program.”
Deming warns us:
“It takes about two years for people to discover that their program that started off with exhortations, posters, pledges, and revival meetings has come to a dead end. Then they wake up; we've been rooked.”
If an improvement's methodology is limited to demanding better results, that's not sustainable. Or, we end up with Dr. Deming's chart.
I've seen data and charts similar to Deming's in healthcare recently. An organization sees improvement, then it tapers off.
Here is a chart show hospital falls data, in terms of weekly numbers. I'm sorry that it's “data without context,” in a way (what size is the hospital, etc. goes unanswered here).
Here is the chart:
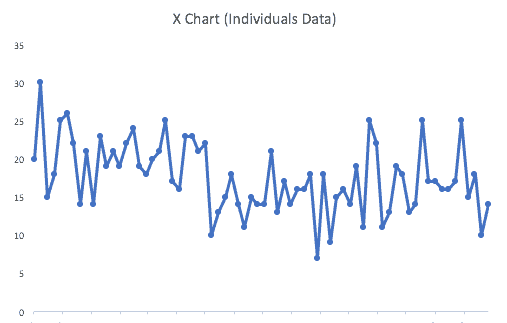
It sort of looks like the Deming chart if we're using rough-cut linear trend lines… it was decreasing, but then stabilized or even got worse?
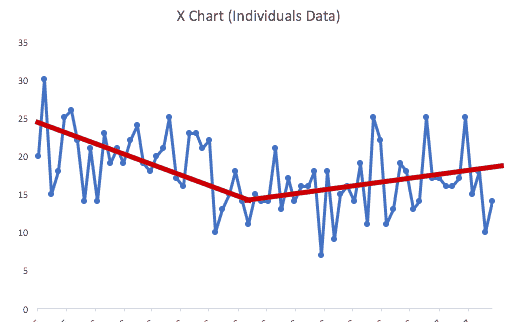
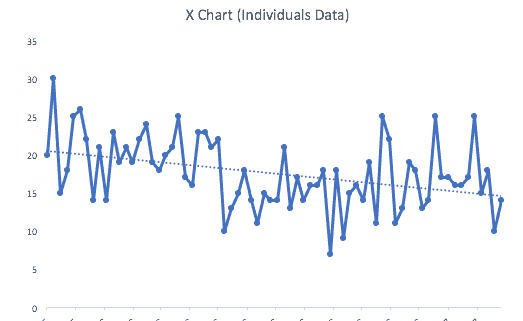
I recently wrote, on LinkedIn, how Excel's linear trend lines are easy, but aren't good statistics.
A linear trend line for this data might suggest continued improvement (the dashed line is the linear trend).
I think better analysis would include looking at control charts (“process behavior charts”) as a way to look for periods when performance is stable and predictable… and to see if there are shifts in performance.
We'd see this, with the paired “X chart” and “MR chart” (learn more about how to create these charts and how to calculate the limits… hint, you don't CHOOSE the limits… they are calculated from the process).
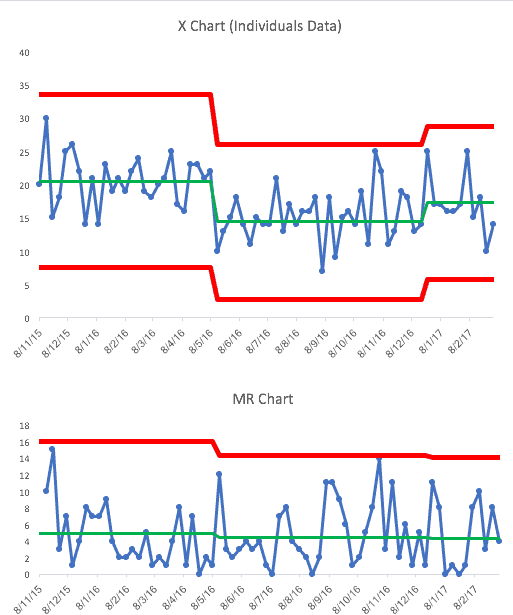
What I see in the process behavior charts (I keep trying to retrain myself to use that term over “control charts”) is:
- A stable system for a while with an average of about 20 falls per week (and there is “common cause variation” around that mean)
- Then, there is a jump down and another stable system with a lower average of 15 falls per week (with about the same amount of variation)
- A third period where the average has gone up a bit… not as bad as at first
I'd ask “what caused the shift(s) in performance at those points in time?”
Did something happen, some change to the system, that caused performance to improve and then get worse?
I see two discrete jumps (or shifts) in performance… not “continuous” or “continual” performance.
It begs the question of what led to the improvement…. by what method?
Was it just management telling people they need to improve or how much “improvement science” was taking place? I don't know this by looking at the data.
How much was management overreacting to every up and down in the data? Did that effort really lead to any improvement? I'd guess that it keeps people busy, but doesn't make things better.
But, it's clearly not Deming's ideal scenario where the average keeps going down continuously.
What do you think of Deming's ideas? What do you of think of my charts and analysis?
Credit goes not just to Dr. Deming but to Dr. Donald J. Wheeler (see my post about meeting him here).
Meeting A Professional Hero: Donald J. Wheeler, PhD, of “Understanding Variation”
Please leave a comment and join the discussion.
What do you think? Please scroll down (or click) to post a comment. Or please share the post with your thoughts on LinkedIn – and follow me or connect with me there.
Did you like this post? Make sure you don't miss a post or podcast — Subscribe to get notified about posts via email daily or weekly.
Check out my latest book, The Mistakes That Make Us: Cultivating a Culture of Learning and Innovation:

: Systemic Issues in Outpatient Surgery")


: Systemic Issues in Outpatient Surgery")
See comments on this photo/graph on LinkedIn
Including:
Mustafa Al-Balushi (BEng.,MSc,Master Black Belt)
This is interesting. The aim should not only be to remove special cause variations but common cause variations which will need more and more work especially from top management.
Jason Morin
When I see a line stabilize like that, it means the momentum for Continuous Improvement has ceased due to one or more events. Changeover in leadership and/or team members is often a reason, or the focus has moved to some new problem. Either way, it’s a sign that the organization’s culture is not rooted Continuous Improvement.
Al Montoya
Thanks Mark. I was in one of his week long seminars back in … 1985 was it. Incredible time, by an iconic visionary.
Love the contributions. The challenge is getting our efforts to influence our organizations past “our” (for we are and must be part of them) paradigms, agenda’s, ignorances, etc., and beyond the realizations of what must be changed and into the realities of our future organizational consciousness of a real and effective means for continuous improvement that is born in passion and perseverance.
Mary Webster, MSN RN CPHQ
Love this & most all that Dr Deming taught. Still so very applicable