Search Results for process behavior chart

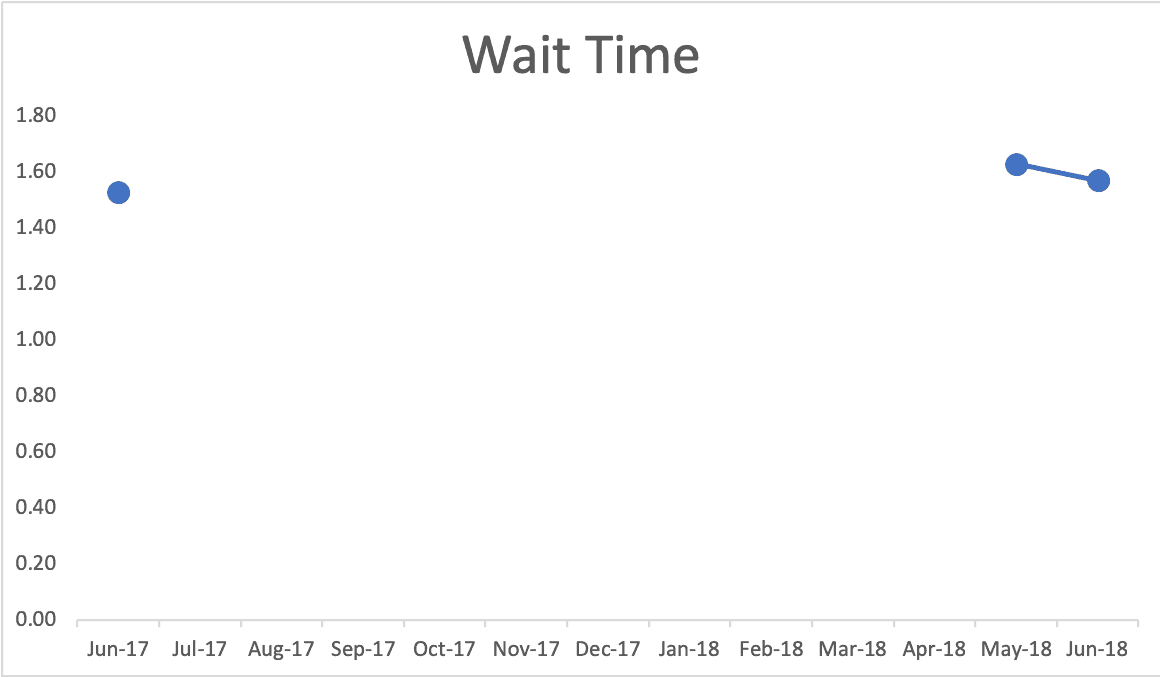
“ER wait times down, but only slightly” or ER wait times are virtually the same?
This article was sent by a friend and blog reader from Winnipeg the other day:

"ER wait times down, but only slightly"
Oh good, the waiting times are down. But what does "only slightly" mean? Have ER wait times gone down in a meaningful way? Or are they just comparing two data points? Is this "down" a matter a signal or is it just noise in the system?

These are the types of questions that can be answered by methods in my new book Measures of Success: React Less, Lead Better, Improve More.

Why Unchanging Metrics Can Be a Warning Sign

1. Nurse in green scrubs drawing blood from a patient's arm with a syringe.

Today's post is some material that I wrote for my book Measures of Success but cut due to length. I've modified the material a bit to hopefully be fine as a standalone post.

There's a somewhat humorous, if not scary, story from a book (This is Going to Hurt) written by a former "junior doctor" in the British National Health Services (NHS) -- the equivalent of a "resident" in the American medical education system.

My Book “Measures of Success” and a Free Webinar Recording

Measures of Success Roller Coaster

I'm still working on my book Measures of Success, as I've mentioned here a few times. 

The partial "in-progress" book is available through LeanPub.com. Or, when it's done, it will also be available through the Amazon Kindle bookstore and I will probably also produce a paperback version.

My goal is to have the book done by the Lean Healthcare Transformation Summit in mid-June (hope to see you there at the Summit and/or my workshop on these topics). 

Here is a recorded webinar that I did for my friend Mike Stoecklein and his organization, the Institute for Excellence (IEX).

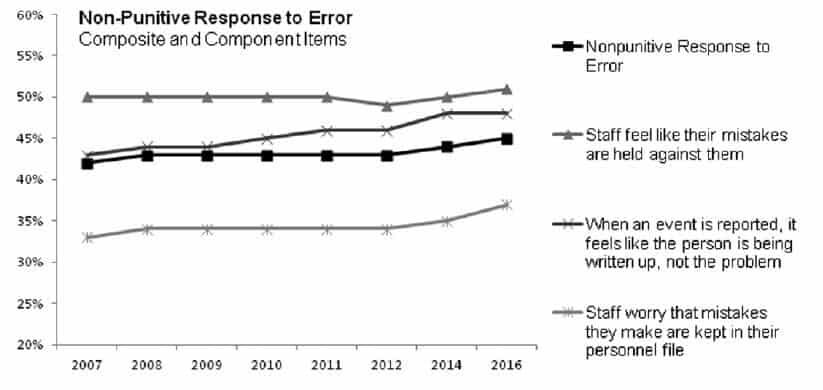
Are Hospitals Not Getting Any Closer to Having “Just Cultures?”

For a long time, I've been an advocate for the parallels between Lean and an approach called "Just Culture." See previous blog posts on this topic. Here's a good overview of Just Culture, which says, in part:

"A just culture recognizes that individual practitioners should not be held accountable for system failings over which they have no control. A just culture also recognizes that many individual or active errors represent predictable interactions between human operators and the system in which they work.

However, in contrast to a culture that touts no blame as its governing principle, a just culture does not tolerate conscious disregard of clear risks to patients or gross misconduct, such as falsifying a record, performing professional duties while intoxicated, etc."

When Hospital Rankings Punish Luck Instead of Performance

I'll be teaching my "Better Metrics" workshop (aka "Measures of Success," ala my book) twice in June:

Cambridge Investments - Open for Public Registration (Fairfield, Iowa) -- June 5
Lean Healthcare Transformation Summit (Chicago) -- June 13

After facilitating the Red Bead Experiment in the workshop, one other way I've found to simulate variation is an online simulation that's available, of all places, on the BBC website:

"Can chance make you a killer?"

Is a Drop in Kaizen Submissions a Real Signal or Just Noise?

Last week, I wrote Part 1 of this piece about TQM and "Small Kaizen" at a Japanese Hospital pharmacy.

The hospital was happy that employees were participating in their "Small Kaizen" process, but there was a month in which they saw the number of submitted Kaizens drop, from about 138 to 58 or so.

As I write about in Measures of Success, two data points usually don't make a trend.

Stop Overreacting to Metrics: Lessons from Lean Startup Week

Thanks to Eric Ries and the organizers for Lean Startup Week for allowing me to share video of my 15-minute talk from last year's event.

One reason for sharing this today is to celebrate yesterday's initial release of the in-progress version of my book Measures of Success. If you buy the book now, you'll get a PDF of the first three chapters, or about 40% of the book's expected content.

Overreact Less, Improve More: Leadership Lessons from Statistics and Psychology

Happy and sad emoji faces on a fluctuating line graph.

Today, I’m giving a keynote talk at the Lean & Six Sigma World Conference being held in Las Vegas. I don’t normally attend or speak at “Lean Sigma” events, but I had an opportunity to give a new talk that touches on two of my favorite themes in recent years – the need to apply statistics and psychology to our “Lean Management” practices or Six Sigma or whatever.

Ratings for “The Oscars” Were Lower in 2018? Should We Ask Why or Look for Longer-Term Trends?

Downward trending line graphic over gold trophy figures representing decline in success or performance.

As I blogged about yesterday, things went well at the Oscars... or, at least, no errors were made in the announcements. But that thing that didn't go well was the TV ratings.

Two Data Points Are Not a Trend
The headlines I saw had a lot of two-data-point comparisons. Headlines sometimes gave the percentage decrease in viewers or how many million fewer viewers there were. Many talked about "record low" but if you're tracking a metric "record low" or "all-time high" doesn't mean there's a "special cause." That "record low" could still be noise in the system.