Search Results for "understanding variation"

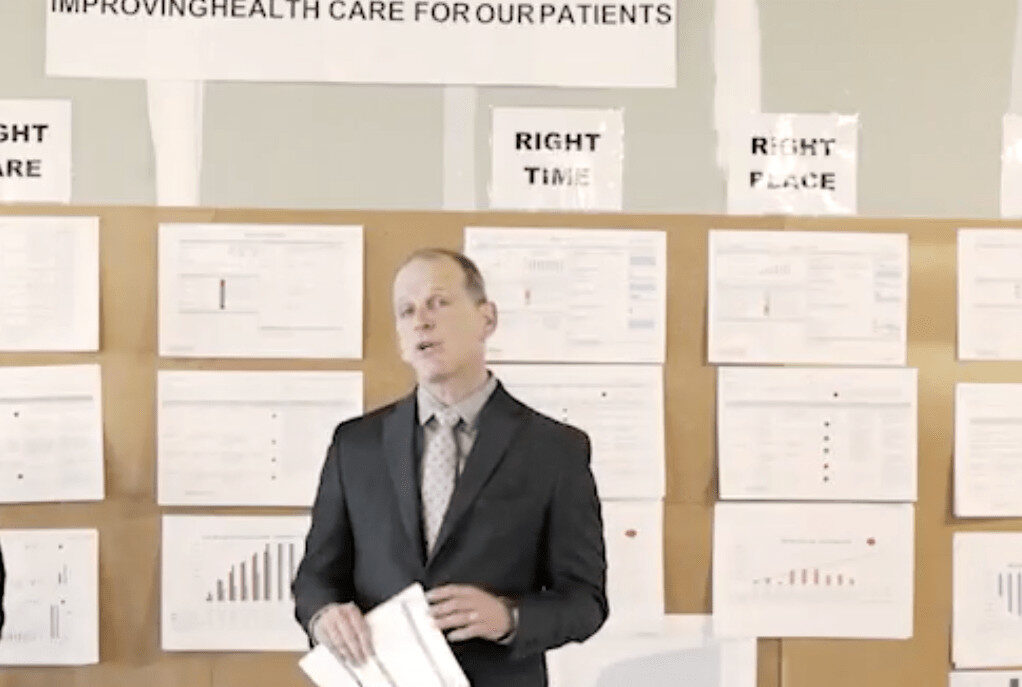
Skip Steward on Deming’s Lessons, Don Wheeler, Process Behavior Charts, and Respect for People

Skip Steward, the Chief Improvement Officer at Baptist Memorial Health Care in Tennessee, was a guest on Episode #314 of the podcast talking about TWI and Toyota Kata in healthcare (he was joined by Brandon Brown).

Today, I've asked Skip to come back and chat 1x1, in Episode #320, about his experience with Don Wheeler, learning from W. Edwards Deming, and more. I hope you enjoy his reflections, our discussions about healthcare, and connections to my book Measures of Success (Skip undoubtedly has a book in him too). 

How Process Behavior Charts Explain Baseball Home Run Outliers

Swinging a baseball bat at dusk against a stadium background with a Lean Blog logo.

If you're not a baseball fan, I apologize for a second baseball-themed post this week. Baseball has a lot of historical time-series data to work with and analyze. If you're not interested in "Process Behavior Charts" or similar methods, I guess I will apologize for this post again too. Next, I'll be apologizing for apologizing.

But, I am at Dr. Wheeler's four-day workshop on "Understanding Statistical Process Control" as I blogged about on Monday.

It's great to learn from Dr. Wheeler in person and I'll be sharing reflections on the class in a later post (and I'm posting a few things on LinkedIn along the way).

In Chapter 1 of Understanding Variation, Dr. Wheeler points out how charts or graphs are far superior to tables or lists of numbers. He uses a baseball example:

Skip Steward & Brandon Brown on TWI, Toyota Kata, and Building the Baptist Management System

Today I have two guests joining me for Episode #314 of the podcast. They are Skip Steward, the Chief Improvement Officer at Baptist Memorial Health Care in Tennessee and Brandon Brown, the owner and "Master Kata Coach" of his firm, Continuous Coaching Commitment, LLC.

In this episode, we discuss their use of methods such as "Training Within Industry" and "Toyota Kata" in the important work of healthcare improvement. Skip and Brandon both have backgrounds in manufacturing, but they have been able to translate Lean skills and mindsets into healthcare. We'll also talk about their dynamic as consultant / client and how the roles of "coach" and "learner" are often very situational and how we can be both at different times.

My Article for the LEI “Lean Post”: React Less and Improve More…

It's been a while since I've contributed something to the Lean Enterprise Institute's online publication, The Lean Post (see past articles).

Today, they're allowing me to introduce some ideas from my book Measures of Success. Many "Lean thinkers" just haven't been exposed to these ideas. Many haven't read Deming or Wheeler... it's not their fault for not knowing of Process Behavior Charts and methods like this.

But, I hope this post helps people see that "bowling charts" and "red/green" analysis are not the only way (or the best way) to look at metrics.

My article:

"React Less and Improve More by Using SPC More Effectively"

How Lean Leaders Mistake Random Variation for Improvement

Here is a chart from a team in San Antonio, where I teach a class on Lean for quality and patient safety twice a year. This team was basically using the “A3” improvement methodology to look at a problem that really impacted patients. My understanding is that a contaminated blood culture bottle leads to false positive results that indicate that a patient has a bloodstream infection when they really don't.

Stop Overreacting to Metrics: Lessons from Lean Startup Week

Thanks to Eric Ries and the organizers for Lean Startup Week for allowing me to share video of my 15-minute talk from last year's event.

One reason for sharing this today is to celebrate yesterday's initial release of the in-progress version of my book Measures of Success. If you buy the book now, you'll get a PDF of the first three chapters, or about 40% of the book's expected content.

Overreact Less, Improve More: Leadership Lessons from Statistics and Psychology

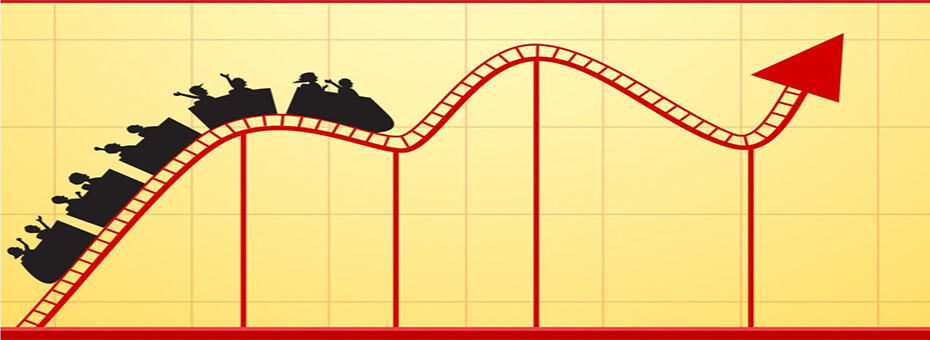
Happy and sad emoji faces on a fluctuating line graph.

Today, I’m giving a keynote talk at the Lean & Six Sigma World Conference being held in Las Vegas. I don’t normally attend or speak at “Lean Sigma” events, but I had an opportunity to give a new talk that touches on two of my favorite themes in recent years – the need to apply statistics and psychology to our “Lean Management” practices or Six Sigma or whatever.