

My Article for the LEI “Lean Post”: React Less and Improve More…
It's been a while since I've contributed something to the Lean Enterprise Institute‘s online publication, The Lean Post (see my past articles).
Today, they're allowing me to introduce some ideas from my book Measures of Success. Many “Lean thinkers” just haven't been exposed to these ideas. Many haven't read Deming or Wheeler… it's not their fault for not knowing of Process Behavior Charts and methods like this.
But, I hope this post helps people see that “bowling charts” and “red/green” analysis are not the only way (or the best way) to look at metrics.
My article:
“React Less and Improve More by Using SPC More Effectively“

Hear Mark read this post — watch with images on YouTube (Subscribe to the podcast):
The article starts:
Lean transformation work is difficult and time-consuming. Nobody complains about having too much time in the day. Therefore, we need to prioritize our use of methods like A3 problem-solving and other ways of grasping the situation. Managers and change agents often err in reacting to insignificant changes in a metric. Or, they declare victory too quickly when a single data point suggests improvement. As I explain in my new book, Measures of Success, when we stop reacting to “noise” in a metric, we can better focus our improvement efforts, waste less time, and improve more. That should be a core principle of Lean management that can help leaders in any setting.
While the heart of most improvement work is based on tracking and responding to meaningful metrics, I've seen far too many lean efforts fall short due to confusion about metrics and KPIs. And not simply because people use the wrong measures. What's worse is that people tend to apply misguided thinking about mining for gold from the cache of data. Donald J. Wheeler, Ph.D., the author of the fantastic book Understanding Variation, says that Statistical Process Control (SPC) is a “way of thinking, with some tools attached.” That reminds me of what people say about Lean — that it's not just tools but also a new way of thinking.
Check out the entire article here.
Are you incorporating these methods into your Lean Management System?
Stop reacting to every up and down in your metrics
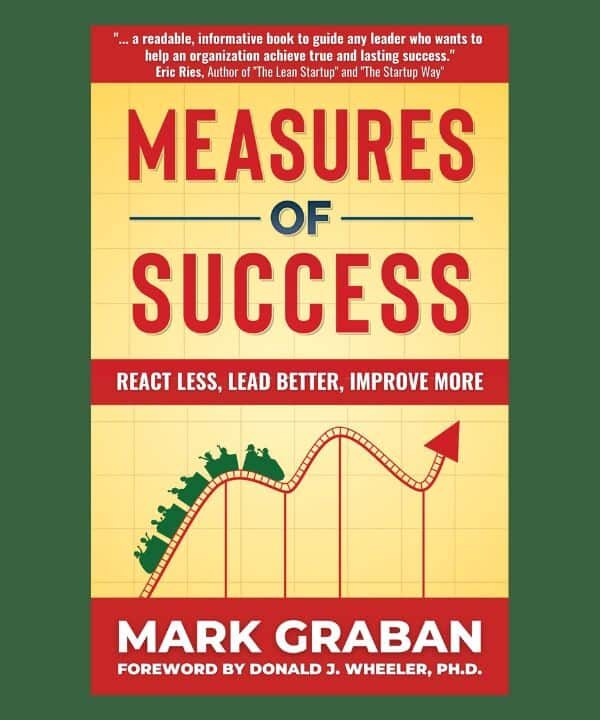
In Measures of Success: React Less, Lead Better, Improve More, I show how Process Behavior Charts help leaders tell signals from routine variation, so they spend less time explaining noise and more time improving the work. The foreword is by Donald J. Wheeler.
Read a free chapterSee buying optionsFree guide: better scorecards





Mark – we couldn’t agree more! We started using process control charts to measure our KPIs across our balanced score card and its really helps us focus our leadership discussions and energy around critical issues. We have been able to track the fruits of our efforts through the shifting process limits over time. We have also been able to illustrate just how consistently bad we are at some thing! In both cases its helped make us better.