


In my travels, I see many organizations using Year-to-Date (YTD) numbers to evaluate performance. Some of it is in the context, at this moment, of using the 2019 End-of-Year (EOY) number to evaluate performance (often compared to the 2018 number and, as we know, two data points are not a trend.
A look back at the EOY 2019 number (compared to 2018 and our goal) might look like this:
| YTD | Previous Year | Goal |
| 69.3% | 61% | 75% |
Executives might look at this department's performance and say performance was:
- Better than the previous year
- Worse than the goal
Those two bullet point statements are true.
But, two-data-point comparisons can be very misleading, in general. They lack context (such as the possibility that the numbers just fluctuate up and down each year). One number being higher than another doesn't mean there is really an improvement trend.
I've heard executives say things like:
“The year-to-date number helps us see how we're doing.”
I'm not sure that's really true. You see something, but I don't think what you see is helpful.
Looking back only at last year's EOY number can mask trends and they can mask leaps in performance that might have occurred mid-year (as the result of Lean methods or other approaches).
Looking back at the start of 2019, we know that the 2018 total EOY/YTD number was 61%. Reporting the year as a single number doesn't tell us if the metric was fluctuating around a stable average or if there was any sort of trend.
So, you get your January 2019 numbers and you might find this encouraging:
| Month | YTD | |
| January | 63.8% | 63.8% |
The number of 63.8% is higher than last year's 61%.
Again, that's a fact, but what does that really tell us? I wouldn't get too excited about that number out of context. I'd love to see monthly numbers from 2018, actually, to help see if performance is just fluctuating the way it had been that year.
As we get a few more months into 2019, we might see this:
| Month | YTD | |
| January | 63.8% | 63.8% |
| February | 61.5% | 62.6% |
| March | 63.9% | 63.0% |
| April | 56.5% | 61.3% |
| May | 59.7% | 61.0% |
The YTD number, through May, is now exactly the same as 2018.
I'd agree with an assessment that said, “Performance isn't any better than 2018.” If the role of leaders is to improve systems, thereby leading to better performance, I'd agree that the leader isn't performing well (realizing that they, also, are part of a system that might be hampering their improvement).
You might be discouraged that there appears to be what some might call a “downward trend” in the monthly numbers. The last two months, April and May, are below last year's EOY number.
But, getting upset about those months might mean that you're ignoring routine variation that exists in the metric. It's possible that the monthly numbers are still just fluctuating around a stable average, as tends to happen with performance measures.
A simple run chart shows us how the number might just be fluctuating (the data points are in blue and the YTD, as it changes each month, is in orange:
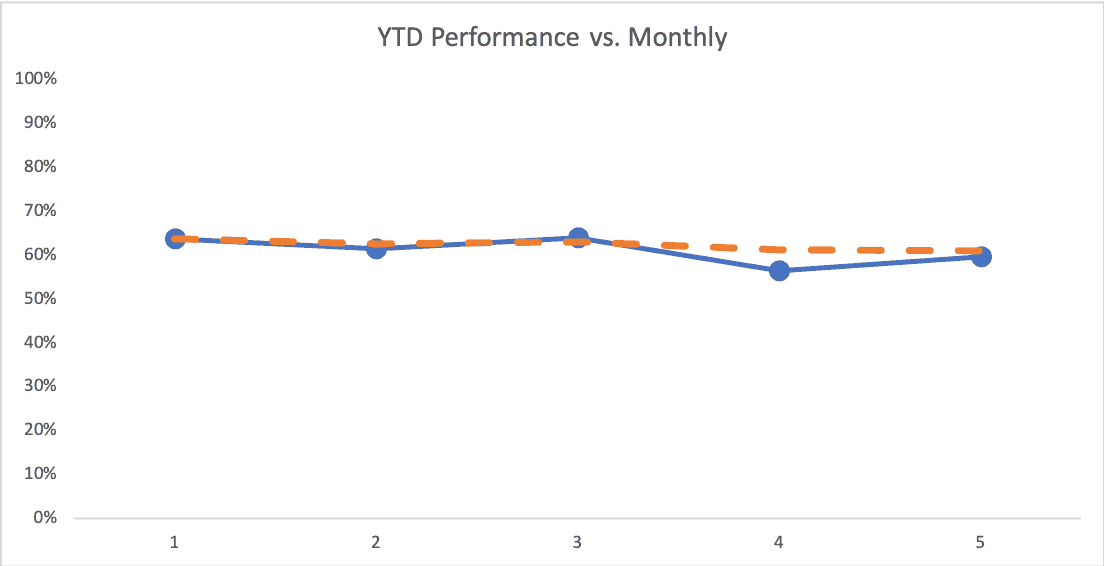
If we look at the data through August, we might have gotten excited about June… only to get disappointed again by the apparent decline in July and August:
| Month | YTD | |
| January | 63.8% | 63.8% |
| February | 61.5% | 62.6% |
| March | 63.9% | 63.0% |
| April | 56.5% | 61.3% |
| May | 59.7% | 61.0% |
| June | 63.0% | 61.3% |
| July | 56.5% | 60.6% |
| August | 59.3% | 60.4% |
But, if we look at the data as a Process Behavior Chart, you might recognize the fact that all of these data points are noise.
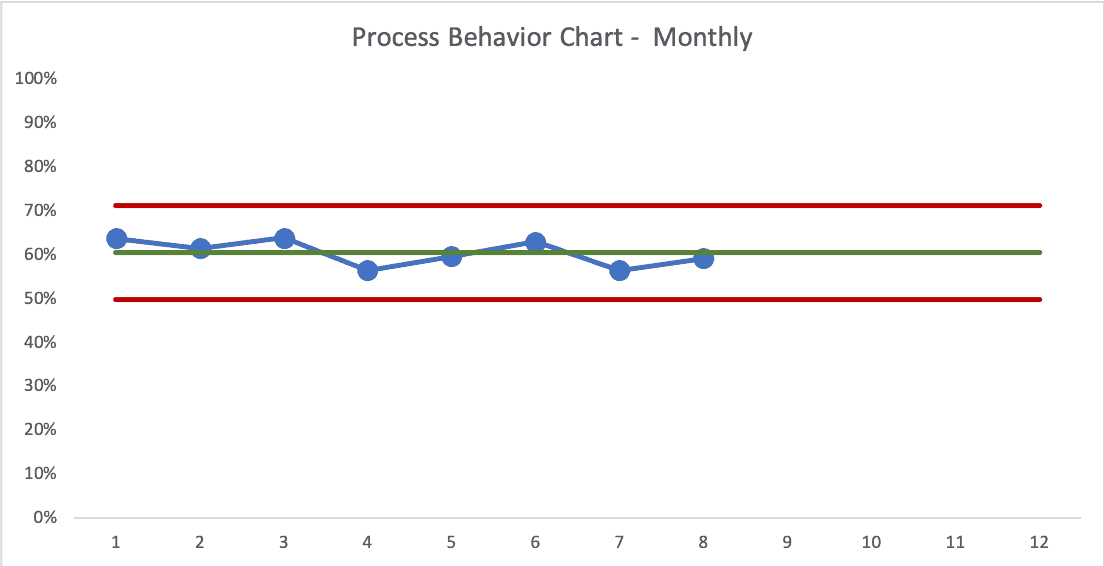
The YTD average is very close to last year's number, which probably isn't surprising if 2019 was simply a continuation of the 2018 system. Management might be trying some small fixes, but the PBC shows that they're not really having any effect on the metric. Or, maybe they're talking a good game and not really improving anything.
But, let's say the department here implementing a fairly major process change in the beginning of September. It might have been a Lean event or a big effort that took place in the month(s) leading up to September… but now we can see the impact on the metric, as the September data point is above the Upper Limit — that's a “signal” that tells us the system has changed in a meaningful way (and that's management's job… to improve the system):
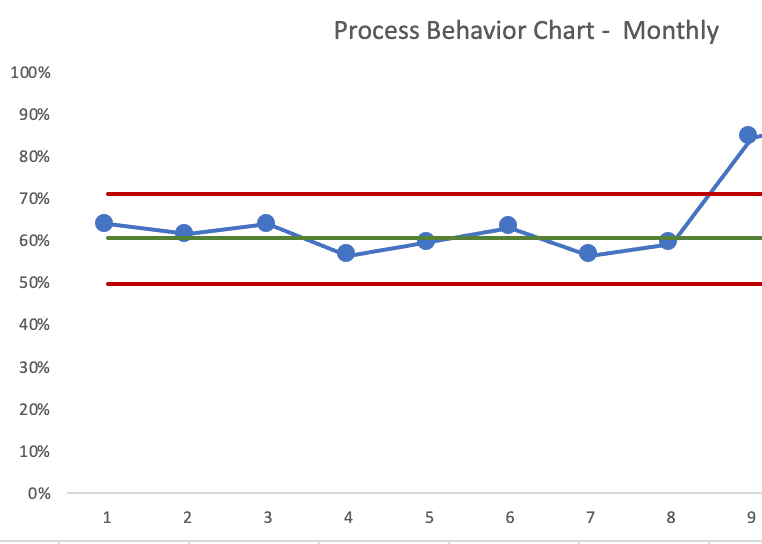
There appears to be a big boost in performance (something leaders should be recognized and rewarded for… if it's sustained) but the YTD number didn't move very much:
| Month | YTD | |
| September | 84.43% | 62.90% |
If the goal was to have a 75.0% EOY number, is that even possible at this point?? Would the leader of this department panic? Maybe they should have implemented this change earlier in the year, but maybe we should be thankful that they didn't just throw in the towel on 2019… waiting to implement these changes in January 2020 when it would have a bigger effect on their annual number?
Here's how the chart looks at the end of the year:
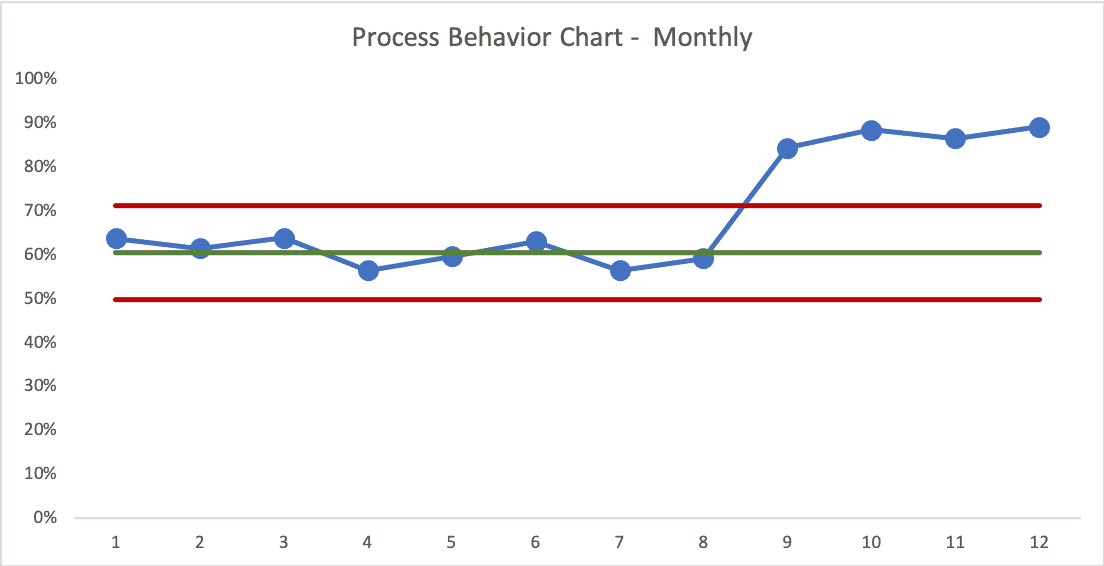
It looks like a big leap upward in performance and it seems to be sustained (for four months anyway).
But, the EOY number comes in at…. 69.3%
That's:
- Better than last year's number (61.0%)
- Worse than the goal (75.0%)
How would you evaluate the leader at the end of the year? Would they get no bonus because they didn't hit their goal? Or, should they be recognized for making a fairly significant improvement for the last four months?
Using the last four data points to calculate a new average and new limits, we'd see this:
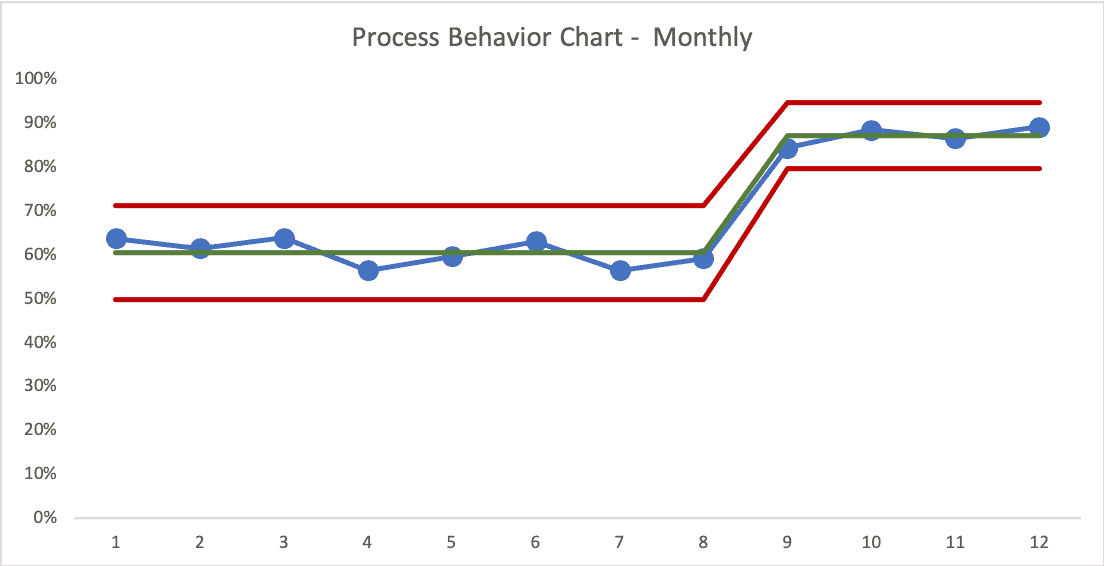
The new average is 87.1% — well above the goal of 75%. The Lower Limit for the new level of performance is 79.6% — also above the goal.
I'd feel very confident that 2020 would continue this level of performance (thanks to the predictive abilities of the Process Behavior Chart approach).
So, again, would you “ding” the leader for not hitting 75%? Or, should you reward them for improving the system significantly?
That's the flaw in using annual numbers. Like I said at the start of the post, using EOY or YTD numbers hides so much detail and context. The PBC approach might help more senior leaders realize that the manager of this department has made (or led) meaningful improvements.
If we punish the manager for not hitting their goal, we might risk losing them to another organization. And why would we want to lose this change agent?
What would you do? What would your organization do? Are you in this situation???
Please scroll down (or click) to post a comment. Connect with me on LinkedIn.
Let’s work together to build a culture of continuous improvement and psychological safety. If you're a leader looking to create lasting change—not just projects—I help organizations:
- Engage people at all levels in sustainable improvement
- Shift from fear of mistakes to learning from them
- Apply Lean thinking in practical, people-centered ways
Interested in coaching or a keynote talk? Let’s start a conversation.


Great article, too often in healthcare there is “panic” over routine variation and/or misunderstood #’s. Thanks Mark!