


The Major League Baseball regular season has ended, so there's an opportunity to revisit some posts about statistics, variation, and Process Behavior Charts.
Bryce Harper's Performance
In August, I wrote this post about Bryce Harper's variation in performance and assertions that he's having a terrible season:
Harper ended the season with an “OPS” of 0.882, which is just below his 2018 number of 0.889. That's a small change. The 2019 number is also a bit below his career average, for what that's worth.
But in the first post, I charted this OPS number on a monthly basis, which gives us more data points.
August was his best month of the season (and people probably overreacted to that) as he regressed back toward the mean in September. Here is an updated Process Behavior Chart:
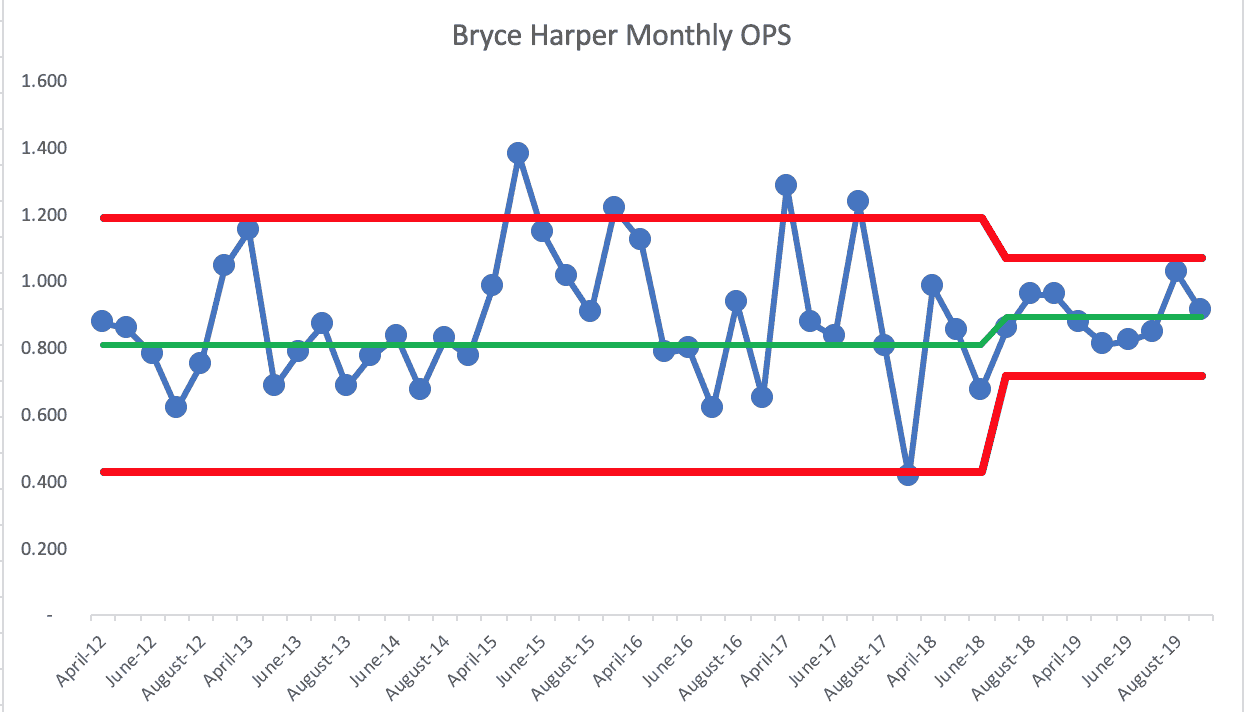
Stepping back and looking at his OPS by season (something I didn't chart in August), here is that PBC, which shows year-to-year, he's a “predictable system” even in this last season with the Phillies.
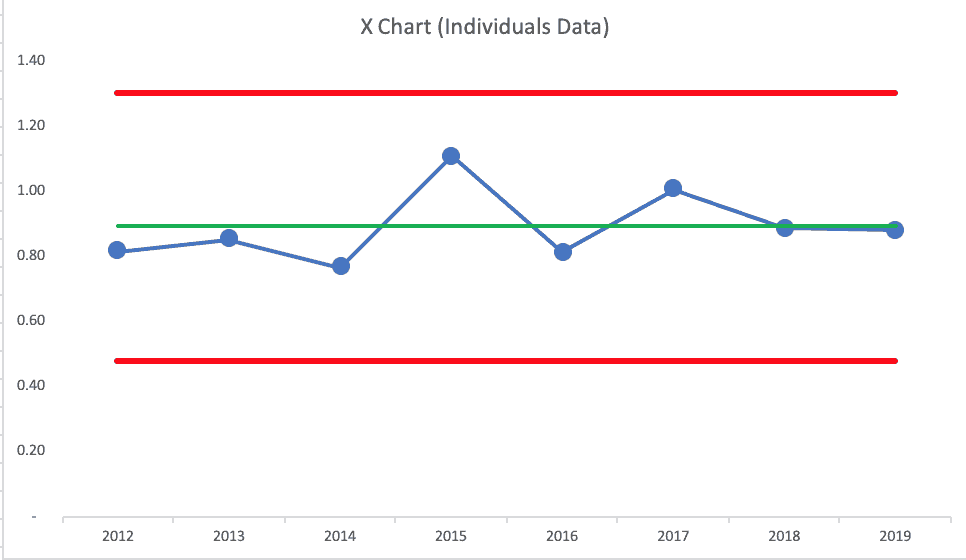
The last two seasons have been almost exactly average by Bryce Harper standards. The problem is that everybody (including the fans) seem to have higher expectations for him (especially after his 2015 season, his best yet).
That one season doesn't mean that we can expect that performance every season. Baseball is funny like that — there's variation in every workplace metric, including this one.
Are Games Getting Longer Still?
Major League Baseball has been taking various measures to reduce the length of game in different ways the past few seasons. This year's average game was over three hours long (3:05), the longest ever, even with those attempted countermeasures.
The length of game was UP compared to 2018, but 2018 was DOWN compared to 2017. Neither two-data-point comparison tells us much.
A run chart going back to 1946 tells us much more:
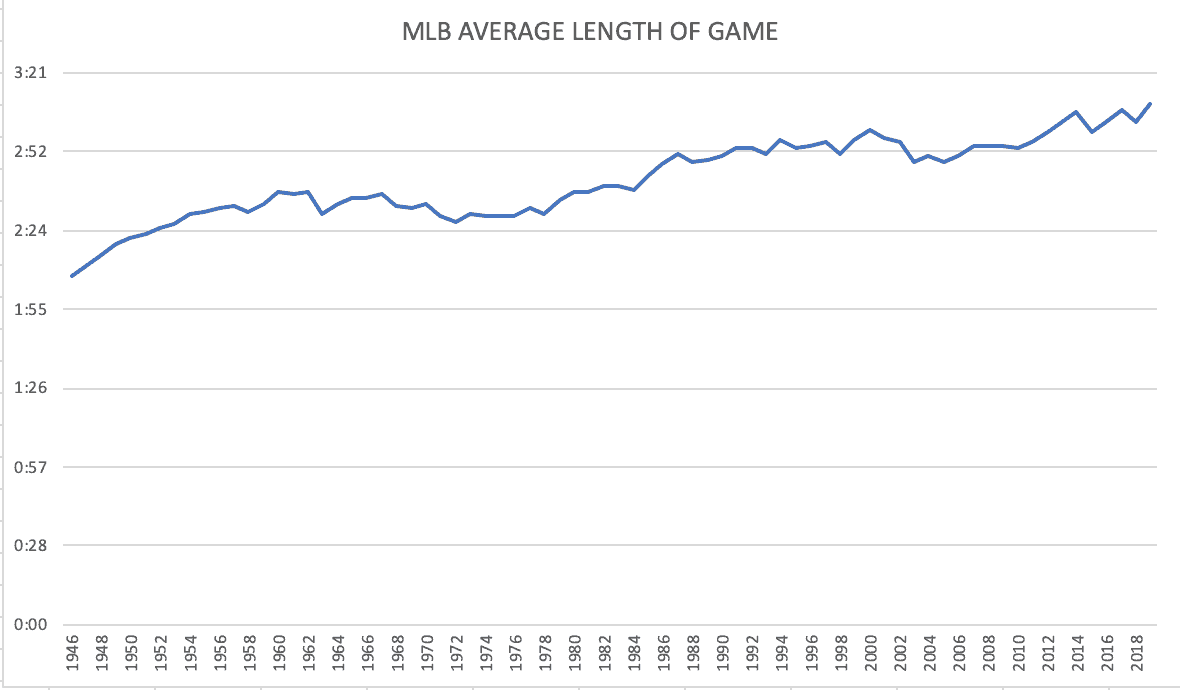
The number appears to just be fluctuating since 2014, if we would zoom in on that. But, length of game doesn't seem like a “predictable metric” over the long term — it's been increasing, and not just fluctuating around an average over my lifetime.
I'm sure MLB had a hypothesis that sending a better to first base on an intentional walk immediately (without going through the motions of throwing four intentional balls) would speed up the game. But, what they didn't anticipate was changes in strategy where teams are issue far FEWER intentional walks than in the past.
So, yes, each intentional walk is FASTER. But there are fewer of them nowadays. Was this countermeasure effective? It's tough to evaluate a countermeasure in a dynamic environment, right?
The biggest contributor to the length of game is changing offensive strategies that lead to more strikeouts, walks, and home runs — three outcomes of an at bat that generally take a long time. Home runs are again at an all-time high… more on that in a bit.
MLB keeps implementing countermeasures and the games keep getting longer anyway. Does that mean the countermeasures are ineffective, or would the games be even longer without those countermeasures in place?
Minor League Baseball has been doing the same things to shorten games — if not doing more — since they have been experimenting with rules that might be used in the big leagues some day.
Here is a post from early 2018:
I've reached out to the Florida State League and they sent updated data. Including the last two seasons, they now have five consecutive below-average years. Three more would be a statistical signal that they've shifted the average down — even if just by an average of two minutes or so.
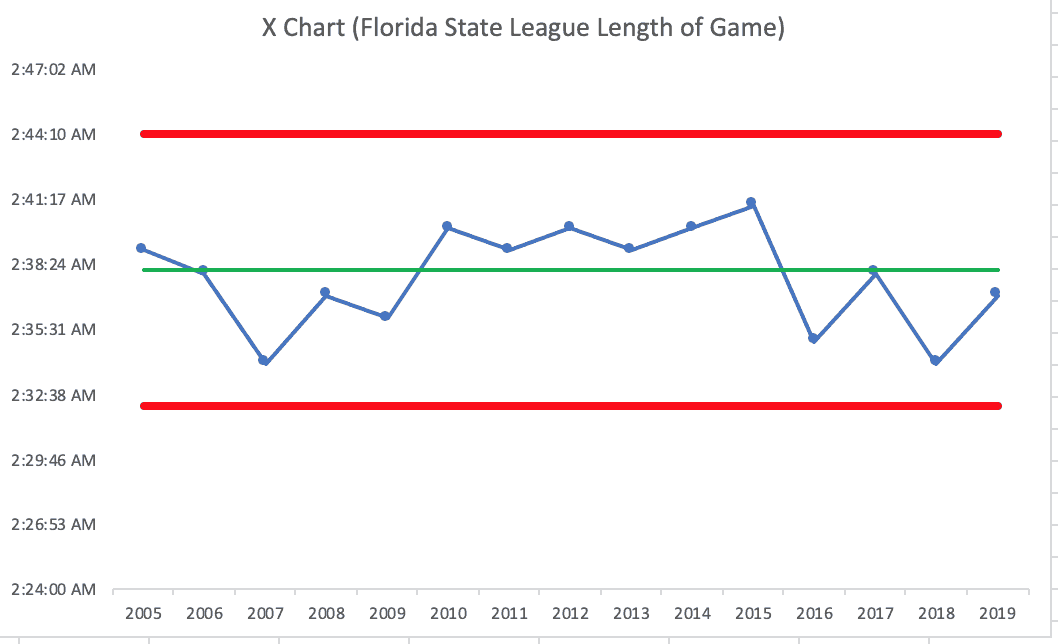
I've asked Florida State League officials for further comment on whether or not they're satisfied with the reduction.
A Strong Signal on Home Runs
As I blogged about in July, this did end up being another record-breaking season for the number of home runs hit in Major League Baseball:
The home runs per game number was 1.36 at that point. It ended the season at 1.394 home runs per game. Yeah, it's still a “signal” in the chart, which is updated below:
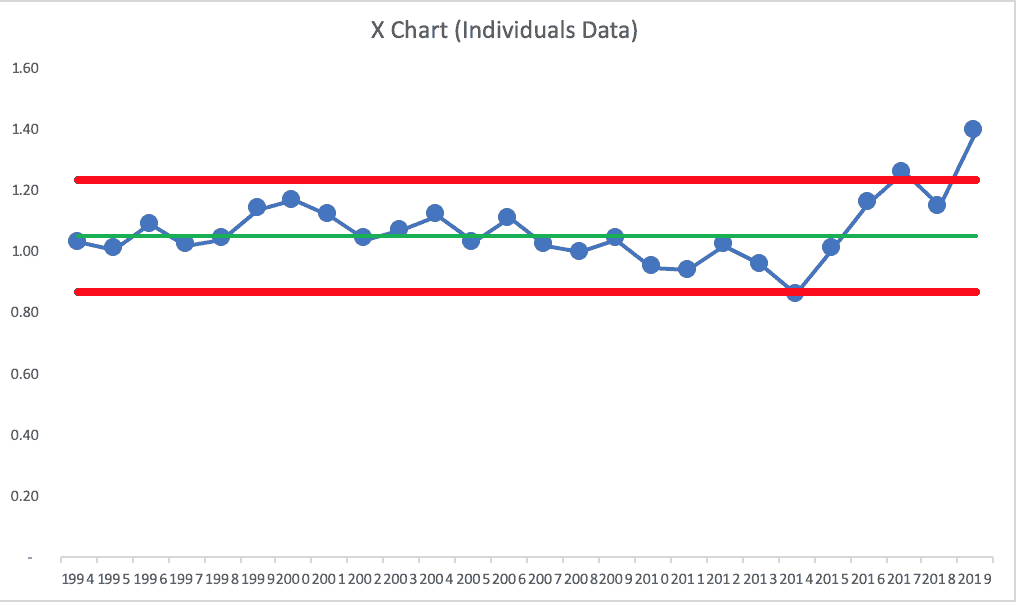
Will MLB take countermeasures next season to get home runs down? That might help the length of game effort… and it might help with attendance.
Declining Attendance
Attendance fell for the fourth straight season, but that doesn't mean it's a statistical signal. I also heard it described on sports radio as “a 16-year low” and that attendance has declined “six out of seven years.”
What does “four straight years of decline” mean compared to a run chart going back to 1950 (charting attendance per game)? See below…
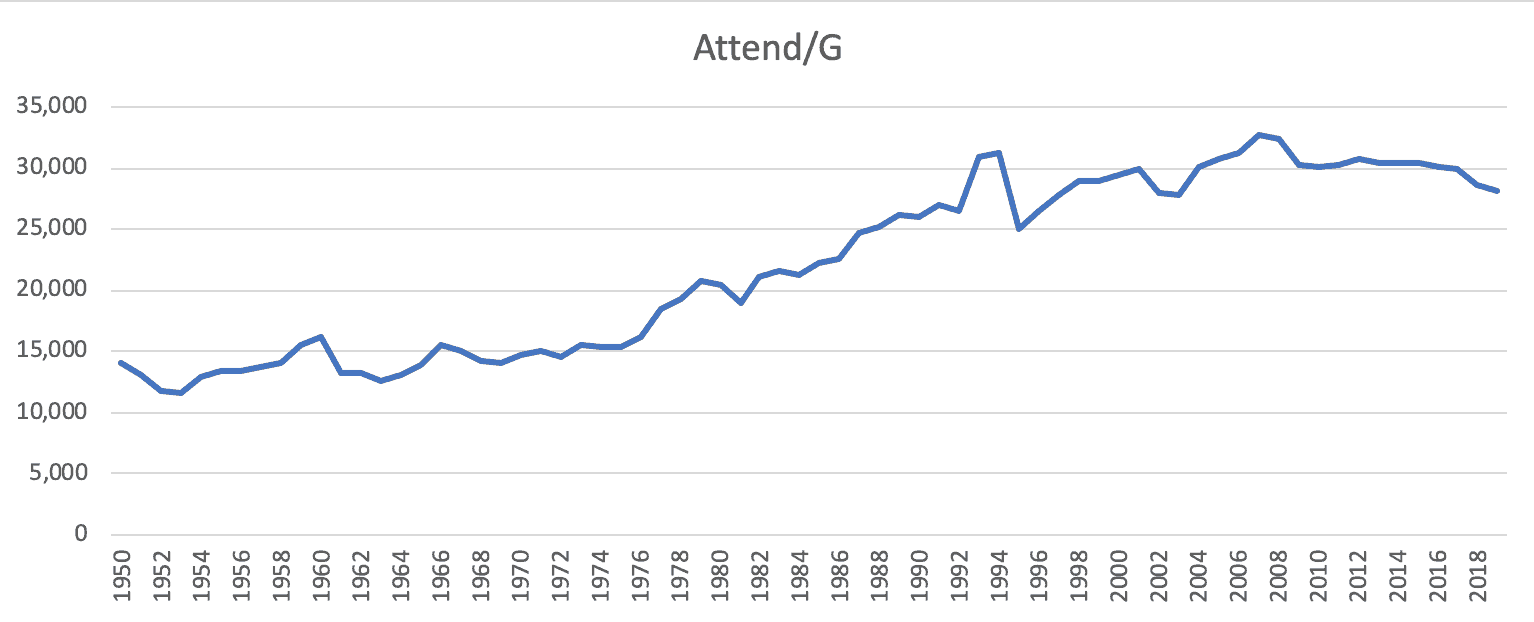
A Process Behavior Chart going back to 2000 shows that attendance is not a predictable system. Those last two years look more troubling because they're closer to the Lower Limit… that means more to me than the four years of decline:
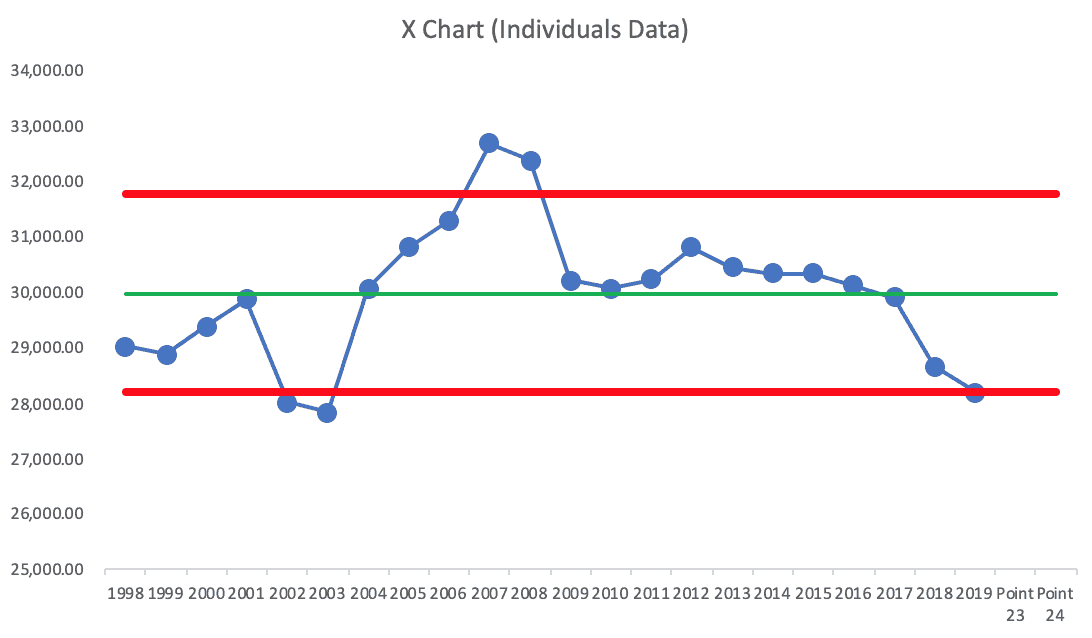
Again, proving cause-and-effect is challenging. Is attendance down because home runs are up? Is there causation? Maybe attendance is falling due to economic and societal trends and it would have been EVEN LOWER without the boom in home runs?
Home runs were lower in 2002 and 2003 when attendance was lower. Does the number of home runs even correlate with attendance (I'm too lazy to do that analysis, but you could)?
Was that low attendance in 2002-2003 due to economic conditions (recession)? Was the financial crisis and the great recession the reason for the big drop from 2008 to 2009? What would happen if we ran a correlation study between GDP growth and attendance? Here's the raw data for home runs on this page and you can find attendance and length of game here. You can download spreadsheets if you like.
Do fans really care that games are longer? Is this affecting attendance? We'd have to get some “voice of the customer” (or “voice of the potential customer”) data. Some fans cherish the slow pace, as evidenced by this article about the increase in fans knitting during games. It goes to show the Lean lesson that “value is defined by the customer” and it's good to remember that not all customers are the same!
Summary
I hope you've learned by now that news headlines can be deceiving. Sometimes the “highest ever” is indeed a signal — but sometimes, it's just noise. “Four straight years of decline” might not be a signal, but there might be a statistical signal hidden within.
The best way to separate signal from noise is Process Behavior Charts.
Even then, the PBC will tell you that something has changed… but it won't tell you what has changed! That's the challenge of improvement and problem solving… knowing you system well enough (or being good enough at investigation) to figure out what really happened.
Process Behavior Charts are not a substitute for process knowledge and going to “the gemba” to investigate. But, PBCs can point us in the right direction and they can help us not waste time explaining noise.
Please scroll down (or click) to post a comment. Connect with me on LinkedIn.
Let’s work together to build a culture of continuous improvement and psychological safety. If you're a leader looking to create lasting change—not just projects—I help organizations:
- Engage people at all levels in sustainable improvement
- Shift from fear of mistakes to learning from them
- Apply Lean thinking in practical, people-centered ways
Interested in coaching or a keynote talk? Let’s start a conversation.


As an avid fan of baseball I do take note that attendance is declining and people simply do not have the time to go and watch a three hour baseball game. That being said, there are some that will sit through a whole double header because that’s how much they enjoy the sport. It goes to show that every customer is different and their needs are different based on their preferences. When relating this to lean, you can look at different factors. One of the things that comes to my mind is the pace of the game. The MLB has room to make adjustments to shorten the game by limiting breaks and pauses throughout the game for media breaks. An analyst will have to run some tests to see how much money they are losing by cutting some time in each game however it may outweigh the risks by increase attendance and ticket sales. This is just one idea that came to mind regarding this topic.
An interesting article with some context around baseball attendance:
MLB’s Empty Seats Aren’t A Problem, They’re Part Of The Plan