


tl;dr: Headlines say kickoff returns are “dramatically up” in 2025, but process behavior charts show this isn't random fluctuation. The NFL's new dynamic kickoff rules created a true signal — proof that system changes drive performance, just as Lean teaches through PDSA cycles.
As we're through the first four weeks of the 2025 NFL season, I've started seeing headlines and articles about a “dramatic increase” in the number of kickoffs being returned this season. Here's one. Some call it a “massive uptick.”
Another way of stating that is there's a “dramatic decrease” in the number of touchbacks.
Quite often, the news media are incorrect in using such language when the increase (or decrease) from last year's number is within the realm of statistical “noise.” This “noise” is observed when a metric fluctuates around a stable average, doing so within predictable limits.
We use “process behavior charts” as a methodology to separate “signal” from “noise” in metrics (as I wrote about in my book Measures of Success: React Less, Lead Better, Improve More.
An example of a metric that's just “noise” is the TV ratings for the NCAA men's basketball championship game (as I wrote about here). The ratings were down 28% year-over-year. That sounds dramatic… but the PBC was “in control”:

Now, let's look at whether the 2025 decrease in touchbacks is indeed “dramatic” (or to use the PBC terminology, “signal”). Let's also discuss the NFL's “Plan Do Study Adjust” cycles and evaluate their countermeasures over time.
Process Behavior Charts
I created a retrospective PBC using all data points back to 1991 to calculate the average (the green line) and the lower and upper limits (the red lines). The NFL didn't have reliable data before 1991, per Pro-Football-Reference.com.
We see that the number is NOT simply fluctuating around a stable average over time:
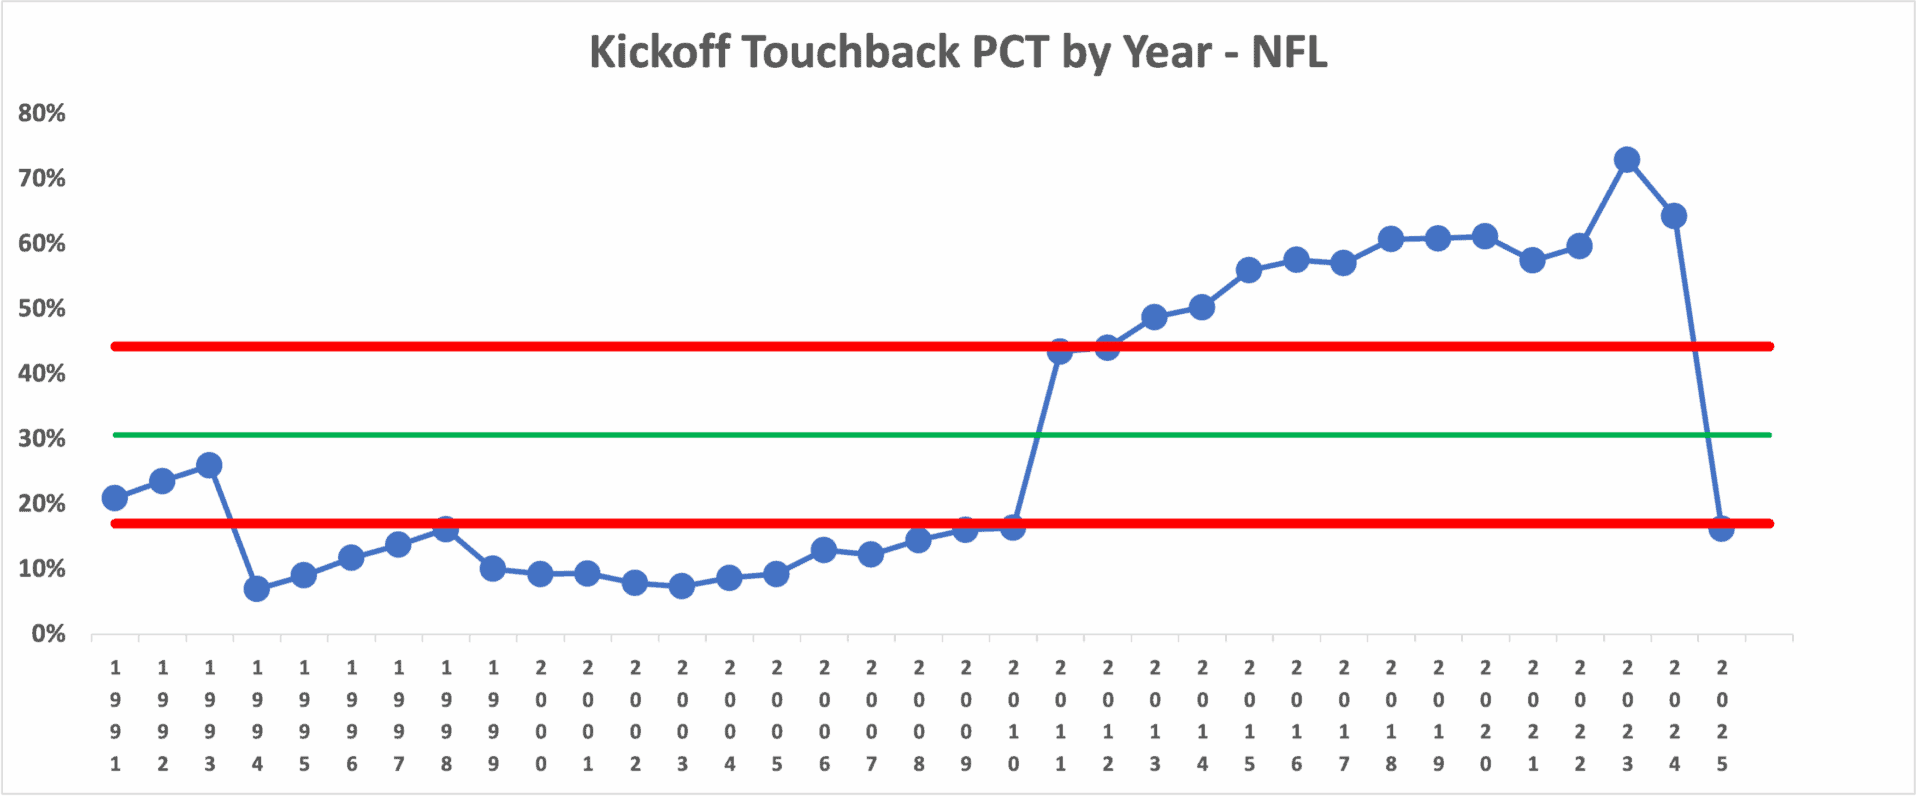
Taken in context, that last data point to the right sure looks like a “signal” compared to the previous years.
But it also looks like there were at least a few significant “shifts” in the touchback rate over the past 34 years. Quite likely, those signals correspond with a change to the rules (as an example of a change to the “system” that generates the output metric).
- 1994 – Kickoff spot moved to the 30 (from the 35)
- 2011 – Kickoff spot moved to the 35 (from the 30)
- 2016 – Touchback spot moved to the 25 (from the 20)
- 2023 – Fair catch inside the 25 is a touchback to the 25
- 2024 – “Dynamic kickoff“
- 2025 – Dynamic kickoff w/ touchback to the 35
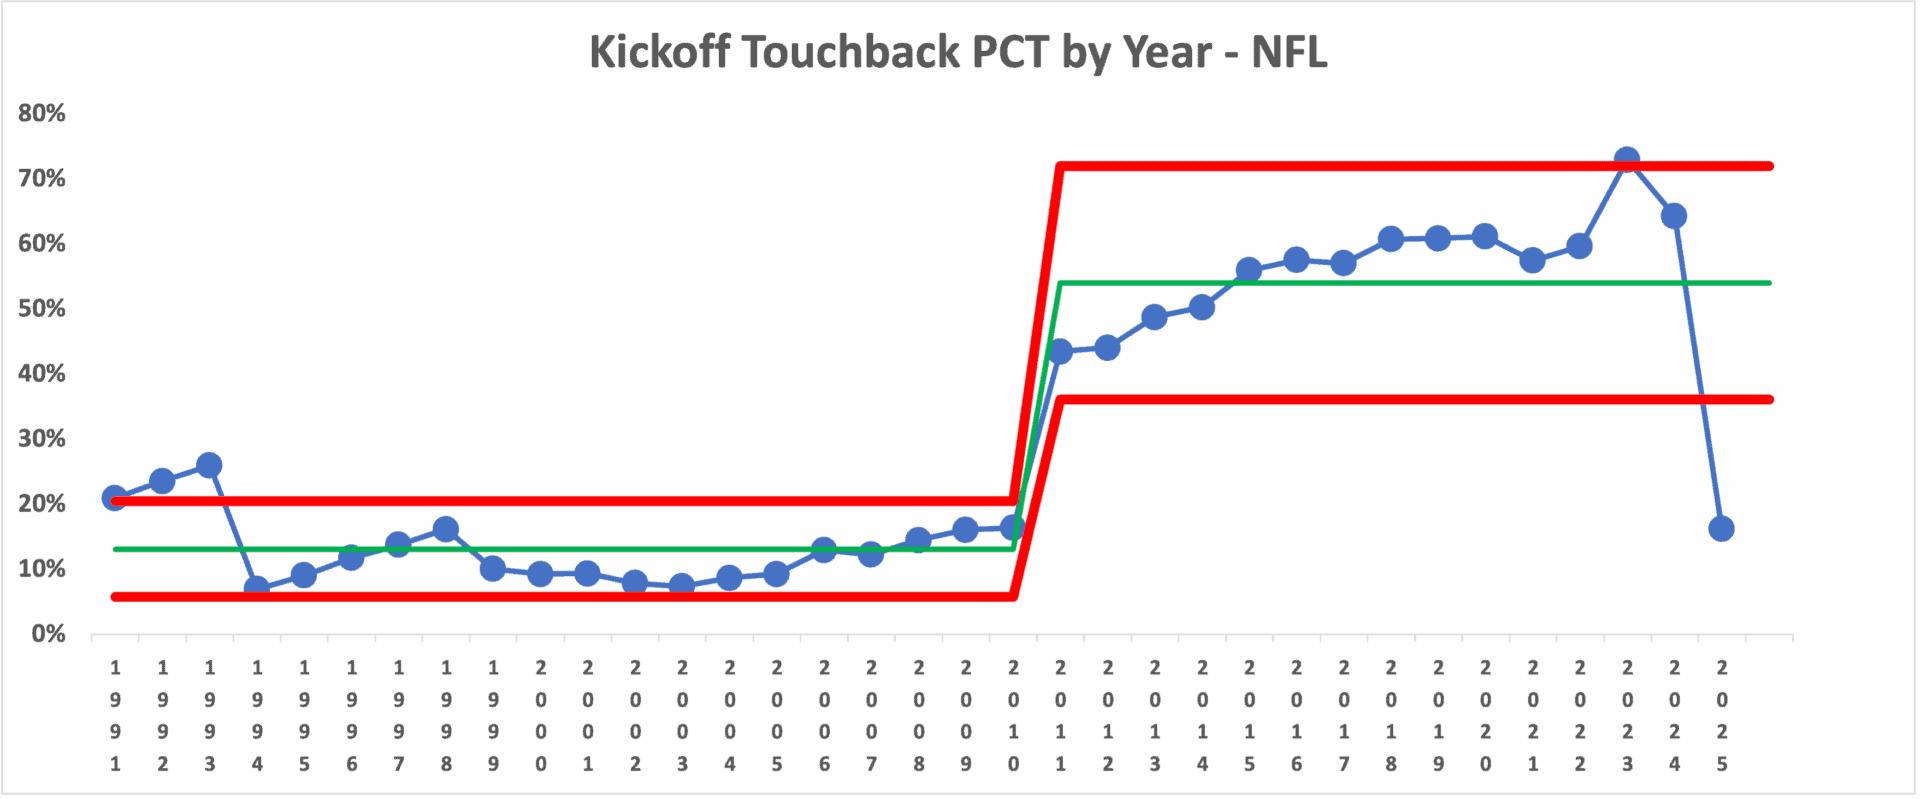
Going back to the start of the chart, I changed the chart so that the average and limits were calculated based on 1991 to 2010, and then starting the new average and limits in 2011 when the kickoff spot was moved five yards closer to the touchback end zone (making touchbacks easier if you're kicking the ball as far as you can).
Looking down at the chart, the first three years are a “signal” because they are above the upper limit. Sure enough, the system was changed in 1994 — and touchbacks dropped when the kickoff spot was then moved five years further from the touchback end zone.
It looks like the touchback percentage was fluctuating around a stable average from 1994 to 2010, so I'll calculate the average and limits for that time frame:
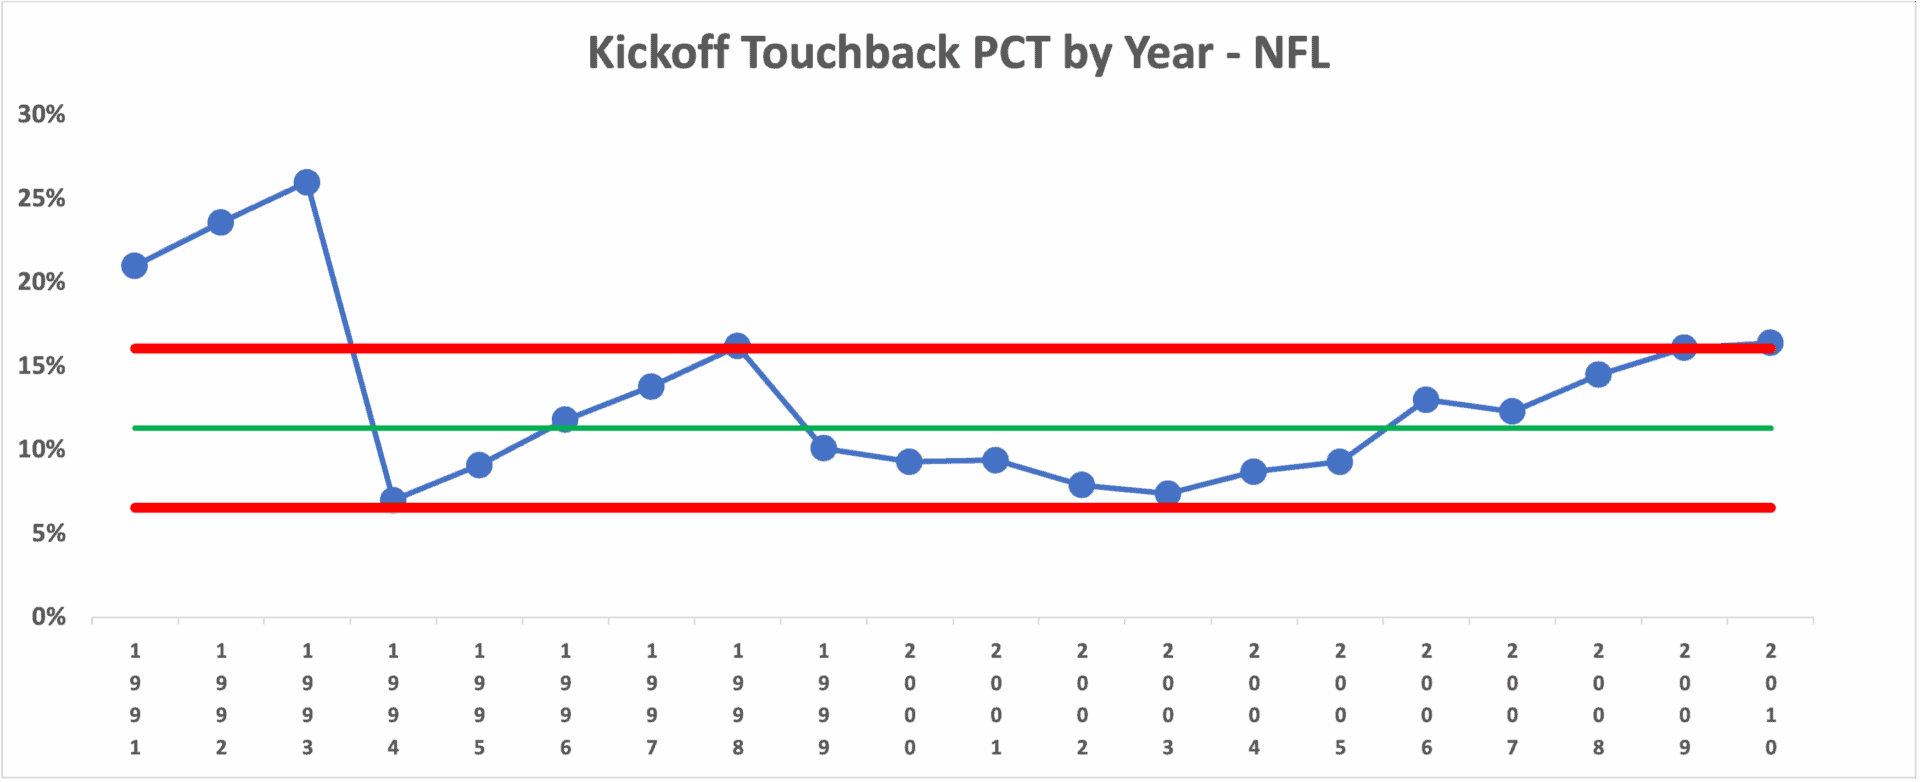
Looking back at that chart, 1994 and 1998 were very near the lower and upper limits, respectively. Then we see seven consecutive below-average data points. Eight or more would be a statistical “signal.” Then, 2009 and 2010 were right up at the upper limit. Those last three data points are a “Rule 3” signal, where those data points are all closer to the upper limit than to the average. Plus, 2010 is a bit above the upper limit.
Those three rules for reference:
- Any data point outside the limits
- 8 or more consecutive data points on the same side of the average
- 3 of 3 or (3 of 4) consecutive data points that are closer to the limit than they are to the average
Scroll back up to the NCAA championship ratings chart — no signals! That means it's not worth trying to explain any up and down, including a 28% decrease. There's just a lot of inherent “common cause variation” in that number over time.
But let's zoom back out on the NFL chart and overlay vertical lines that show when the rules changed (the system changed).
Starting with the 2016 season, we see more than eight consecutive data points above the average. Moving the touchback spot out to the 25-yard line gave the receiving team more incentive to not return kicks out of the end zone. So that cause-and-effect relationship makes sense.
But the largest touchback increase came in 2011. If the NFL simply wanted to reduce touchbacks, they could have reverted to the 2010 rule — kicking off from the 30.
However, the NFL was also growing increasingly concerned about the number of concussions and serious injuries suffered during kickoff returns. So that wouldn't have been the right countermeasure.
Oh, first, looking at some of the details from the last three years: the 2023 increase (above the upper limit) was the result of allowing teams to fair catch the kickoff inside the 25-yard line.
The NFL's Dynamic Kickoff
In 2024, the “dynamic kickoff” was intended to:
- Reduce touchbacks (increase returns)
- Reduce injuries
The NFL wasn't just guessing that the dynamic kickoff would work. They based their hypothesis on previous tests that were done in the XFL — making a few modifications to the approach.
The NFL accomplished the injury reductions. However, the chart indicates that touchbacks didn't decrease significantly in 2024. The additional countermeasure here in 2025 did move the needle.
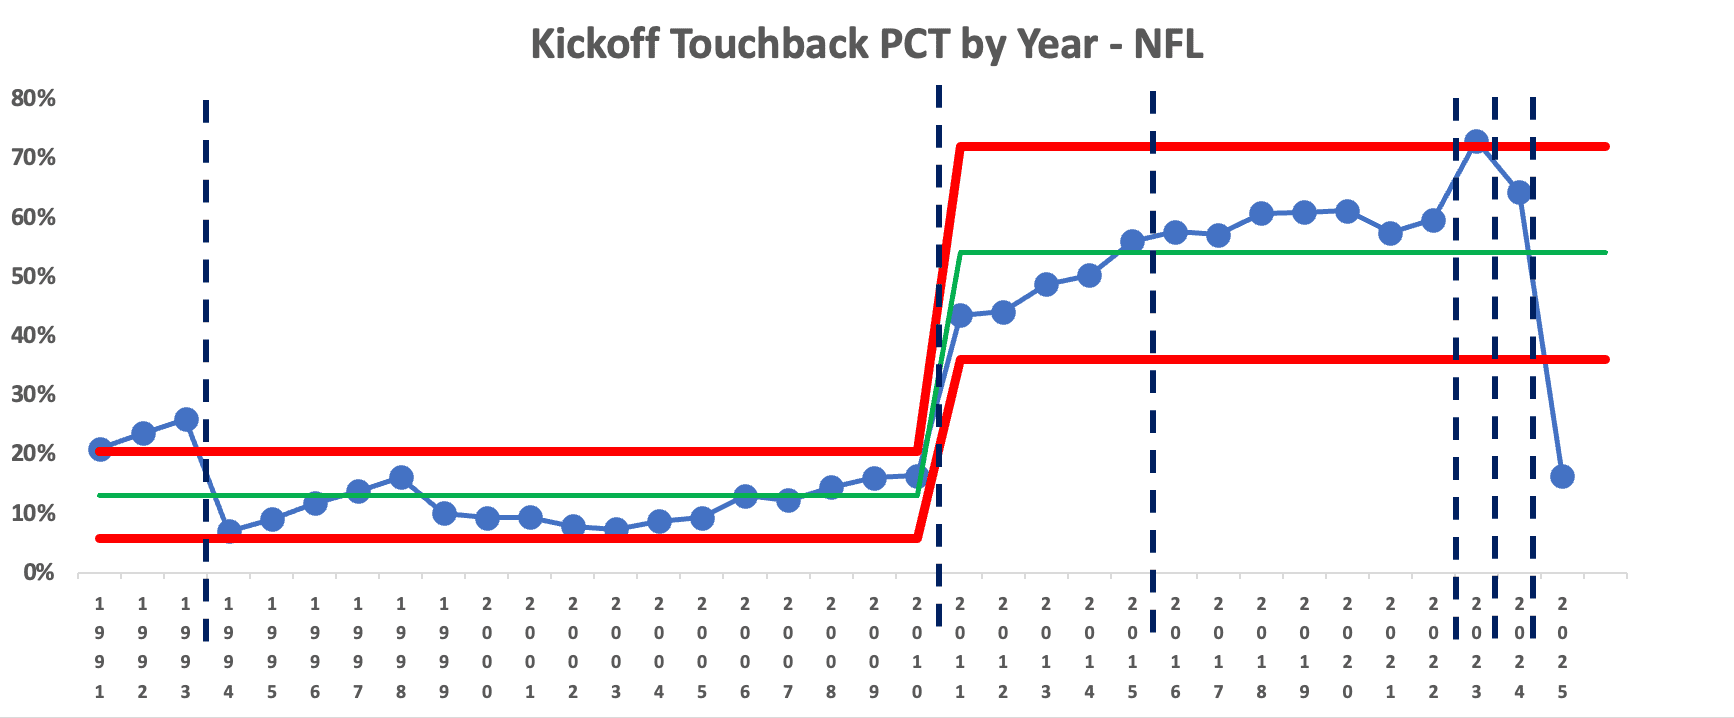
In comparison, this 2025 season's countermeasure, which punishes the kicking team for kicking the ball out of the end zone for a touchback or rewards teams for taking more chances on returns, has definitely made a significant difference. Statistically significant and “dramatic.”
The Final Drive
Looking at the long-term data, it's clear that 2025 isn't just another wiggle in the chart. The new dynamic kickoff rules created a statistically significant signal — the kind of shift that comes only when the system itself changes.
That's the real lesson here. Metrics don't move “dramatically” on their own. Signals emerge when we alter the process that generates the results. In Lean practice, that's why we rely on PDSA cycles: plan a countermeasure, implement it, study the results with the right tools, and adjust. Headlines may tell stories; process behavior charts tell us whether the story is real.
Related Post:
When MLB introduced a pitch clock in 2023, they generated a very strong signal–games were significantly shorter than below.
I bet you can tell which year the pitch clock was introduced by looking at the chart!

Related Podcasts
In the “My Favorite Mistake” podcast series, I was able to speak twice with Dr. Thom Mayer, the medical director for the NFL Players' Association, on the topic of kickoffs and injuries:
Please scroll down (or click) to post a comment. Connect with me on LinkedIn.
If you’re working to build a culture where people feel safe to speak up, solve problems, and improve every day, I’d be glad to help. Let’s talk about how to strengthen Psychological Safety and Continuous Improvement in your organization.


Once more data is available a similar analysis can be done about field goal success rate by distance. This year there is a new process for preparing the balls used for attempting field goals.
Yes. Great example of a system change that will likely lead to shift in accuracy and maybe new records set for longest field goal.
Kickers had already gotten so accurate, especially on long kicks. I wonder what problem the NFL was trying to solve with the new “K ball” rules?
And another example, which I should chart, is the number of stolen bases in MLB increasing (and success rate increasing) when MLB changed the system:
1) limit on throws to first and stepping off the mound
2) larger bases
Comments are closed.