


One of my goals with my book Measures of Success: React Less, Lead Better, Improve More was to reach audiences that haven't heard of “Process Behavior Charts” (aka Control Charts or Statistical Process Control).
In December, I had the opportunity to be interviewed by radio host Gordon Deal for one of his podcasts, Your Money Now: The Small Business Report. I used to listen to Gordon a lot when his broadcast radio show used to be called “The Wall Street Journal This Morning.”
Anyway, here is the podcast interview that he posted:
Transcript:
[background music]
Gordon Deal: Welcome to “The Small Business Report.” I'm Gordon Deal. We examine things like habits of entrepreneurs, emerging trends, financing, marketing, where to get help, even how to get started on your own.
Mark Graban wants small businesses, organizations and the people who lead them to stop overreacting. He's a consultant, professional speaker, and author of a new book called “Measures of Success.” He works with leaders and organizations that are looking for ways to improve, but as Mr. Graban points out, that often starts with knowing when not to make changes.
He's with us today from Orlando, Florida. Mark, what are examples of overreacting?
Mark Graban: We see examples of this in all sorts of different businesses. There's a software company, KaiNexus, I've been involved with. Sales are increasing, but there's a lot of metrics that really just fluctuate around an average, the number of leads that come in, the number of webinar attendees.
The team within that company, I've coached them to stop over-explaining every up and down in the metric, “It's higher than last month,” or, “It's below average.” When we react and try to explain every up and down, that just ends up being a waste of time because metrics quite often tend to fluctuate.
The time we spend trying to over-analyze gets in the way or prevents us from spending time that would be better used to actually improve performance instead of explaining every up and down.
Gordon: Do you have to learn to move beyond that? [laughs] Do people get entrenched?
Mark: Yeah, I think there's a lot of human nature. A lot of us are taught in organizations where leaders are constantly reacting to every up and down. We can think in terms of our personal life, if you step on the scale every morning, even if your weight is relatively consistent, that number on the scale is not going to be the same every day.
There's no reason to get too excited about being up 0.7 pounds or down 1.2 pounds. If we take a little bit longer-term look at a metric like that, we can learn to stop reacting as much and focus on what we can do to really more meaningfully improve that number that we're looking at.
Gordon: One of the things you like to talk about is using process behavior charts. What are they? How do they work?
Mark: A process behavior chart, you can build one in Excel. Excel calls it a line chart. [laughs] It's true to say, two data points are not a trend, so if you have a metric, look at a year's worth of data or two years' worth of data, charted visually. That's a great start because now you can start seeing if it's fluctuating.
A process behavior chart is a specific statistical method that looks at your performance. You could think of it as guard rails around your metric, above and below. Those guardrails tell you when the metric is just fluctuating within a predictable range, and you learn not to overreact to that fluctuation.
If you see a data point that exceeds those guardrails, now you say, “Ah, something has really changed.” That's worth investigating. That's worth learning from. That's worth reacting to. We filter out the noise in a metric and that helps us find more meaningful signals through process behavior charts.
Gordon: It does seem like sometimes there's so much data these days that it becomes noise.
Mark: Yeah. Through a method like this, it's just actually pretty simple to use and it's really visual, we can realize when there's a meaningful change and try to turn this flood of data into information that helps us make better decisions about our business.
Gordon: We speak with Mark Graban, consultant, professional speaker, also author of a new book called Measures of Success. We're talking about how to stop small business owners from overreacting. You've got these points — stop, use, utilize, and improve. Explain the utilization of these simple rules you go by.
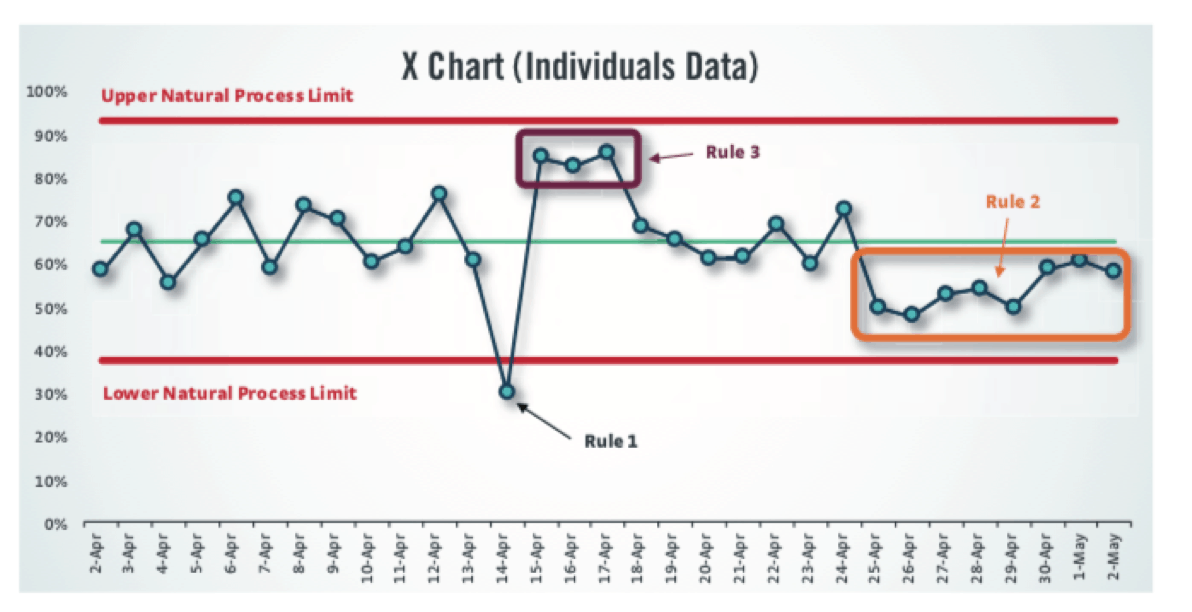
Mark: When we make a process behavior chart, there's three rules that help us find a signal that, again, that says something has really significantly changed in our business.
If we look for any one data point outside of those calculated guardrail limits, if you see a trend of eight consecutive data points that are either all above average or below average, that's statistically unlikely to be random. That's another signal that tells us performance has changed.
The third rule, you can look for a clustering of three data points that are relatively close to one of those guard rails. There's statistical theory behind this, but it's a really solid, practical method for business owners or leaders of different type.
Note: A visualization of the three rules:
Gordon: Explain your final point here about improving performance in a more sustainable way.
Mark: When we're trapped in that pattern of overreacting, that wastes time that could be better used for coming up with sustainable improvements, or we might fool ourselves. Let's say we start a new marketing campaign and we see one data point where sales have ticked up a little bit. We might draw the one conclusion between the change we've made and the impact.
We might declare victory too soon. We might double down on that marketing campaign. When we see future weeks or future months, we realize, “Oh, with sales, it's still just fluctuating within that range that we had before.”
When we use statistical methods and charts like this, we can better understand the cause and effect relationships. When we make a change to our business, is it really affecting the results and helping us accomplish what we're trying to achieve?
Gordon: You find that this is a better approach for certain businesses rather than others?
Mark: It's broadly applicable in any business that has metrics or performance measures. I've used this approach in manufacturing businesses, in healthcare, in businesses like software companies. At one point, my wife and I considered buying a business. [laughs] We used a process behavior chart to look at monthly revenue for the business. It's pretty stable and predictable. It fluctuated.
It was not the same number every month. We saw one month that was higher, above that calculated guardrail limit. We asked the business owner, “Well, do you know why sales were higher that month?” Unfortunately, he didn't know, which was a lost opportunity for him to better understand his business.
If there was a specific reason for why sales were higher that month, that's something you'd want to try to recreate and duplicate every month instead of having it be just that one time blip.
Gordon: Have you seen somebody make a change based on something, I don't know, like a meaningless piece of data, and just cause everything to crumble?
Mark: If things don't crumble, it just creates a distraction where we make a change and we think it had a positive impact. We keep plowing forward instead of looking and saying, thinking to the example of a marketing campaign, maybe that marketing campaign wasn't really having the right impact, so we should either tweak that campaign or end it and try something new.
A methodology like this helps organizations that are trying to, in a way, manage their business more scientifically. We see this in areas like the Lean Startup movement where companies don't just come up with a plan and plow forward. They're constantly evaluating and thinking about changes they make to the business as more of a scientific hypothesis.
It sounds esoteric, but I think the practical matter is, let the charts speak to you. Look at how your metric is performing visually over time, instead of just reacting to, “Well, last month was either higher or lower than the month before.” You don't learn much from looking at just two data points.
Gordon: More broadly speaking, what do you feel like is the environment today for the small business owner or operator? What's the feedback you get from clients and such?
Mark: There's a lot of pressure to improve in different ways, and sometimes that drives people to track more metrics. That can create a fog instead of creating clarity, where people are tracking more metrics, there's more opportunities to react, ask people to investigate and explain changes in those different metrics.
They might lose sight of the handful of key performance indicators. Some people talk about KPIs and they forget sometimes instead of key performance indicators, it becomes a kajillion process indicators. A lot of that management, busyness, and activity of looking at all of those metrics sometimes just keeps people busy.
Process behavior charts are a great way of filtering out changes, help us respond to changes and metrics that are meaningful. My advice would be, instead of adding more metrics, take a better look at the key metrics that you're already tracking. That might be a better path to figuring out how to improve your business. Measuring something in and of itself won't lead to improvement.
Gordon: Thanks, Mark. Mark Graban, small business consultant, professional speaker, and author of a new book called Measures of Success.
Reminder, by the way, The Small Business Report is found on our website, which is thismorningwithgordondeal.com. That's also where you can hear our daily news program called “This Morning, America's First News.”
[background music]
Gordon: Thanks for listening to The Small Business Report. I'm Gordon Deal.
[music]
Please scroll down (or click) to post a comment. Connect with me on LinkedIn.
Let’s work together to build a culture of continuous improvement and psychological safety. If you're a leader looking to create lasting change—not just projects—I help organizations:
- Engage people at all levels in sustainable improvement
- Shift from fear of mistakes to learning from them
- Apply Lean thinking in practical, people-centered ways
Interested in coaching or a keynote talk? Let’s start a conversation.


