


TL;DR: A single-month drop in Kaizen submissions can look alarming, but without historical context it may be normal variation. When Kaizen activity is analyzed using a Process Behavior Chart, the apparent dip in this Japanese hospital turns out to be noise rather than a signal–suggesting leaders should focus on improving the system, not reacting to individual data points.
When leaders see a sudden drop in Kaizen submissions, the instinct is often to react–ask what went wrong, push for explanations, or introduce quick fixes. But without context, those reactions risk addressing noise rather than real problems. This post uses Process Behavior Charts to examine whether a dip in Kaizen activity represents a meaningful signal or normal variation in the system.

Last week, I wrote Part 1 of this piece about TQM and “Small Kaizen” at a Japanese Hospital pharmacy.
A Drop in Kaizen Activity Raises the Wrong Question
The hospital was happy that employees were participating in their “Small Kaizen” process, but during one month, they saw the number of submitted Kaizens drop from about 138 to 58 or so.
Why Two Data Points Don't Show a Trend
As I write about in Measures of Success, two data points usually don't make a trend.
Thankfully, the hospital presented a chart. I would prefer just a simple run chart (or line chart) compared to a column chart. A 3D column chart is even more challenging to read, but here it is:

Seeing more data, even just ten months, provides more context.
It looks like activity did fall quite a bit in month 10. But it had previously jumped up quite a bit from month 8 to month 9.
But, are any of these changes worth reacting to? Or, is the number of Kaizens just fluctuating in a predictable way around an average? In other words, this is all “noise in the system”, or are there any signals worth reacting to?
Adding Context With a Process Behavior Chart
The “Process Behavior Chart” is a tool we can use to make better decisions about the chart.
Here is the chart, using all ten data points as the baseline that's used to calculate the upper and lower process behavior limits (I did my best to estimate the numbers from the column chart provided by the hospital) – showing the “X chart” (the data) and the “MR chart” (the point-to-point differences) together:

What the Chart Shows: Noise, Not a Signal
What does the Process Behavior Chart tell us?
I see nothing but “noise.” There are no points outside of the calculated upper and lower limits. There are no runs of eight data points above or below the average. We don't see any abnormal clusters of data points near the limits.
If we were to ask “what changed in month 8?” or “what happened in month 9?” – the answer might be “nothing.” There's no “special cause” of either of those changes in the number of Kaizens. Any metric will have variation. The question is “how much?” The MR chart shows no abnormal or unexpected jumps up or down between data points.
The same consistent system can generate these different results. The chart tells us we could expect to see between zero and 167 ideas each week (the lower limit, although calculated to be -12.25 can't really be negative for something we count).
Asking the Right Question About Improvement
The hospital asked the question:
“Why is Small Kaizen Contest becoming not as active as before?”
With all due respect to the hospital, I don't think that's the right question to ask.
If they're not happy with an average of 77.6 Kaizens per month, or with the level of variation, they can look to improve the system.
A better question is:
“How can we improve the system as to boost the average number of Small Kaizens?”
Improving the System Instead of Chasing Causes
The answer to improving the system won't be found in asking, “What went wrong in month 10?” The answer comes from studying and improving the system. Ironically, that seems to be what the hospital did, building on their Total Quality Management experience.
They formed a panel to work on this challenge. They mapped the current situation with a process flow diagram. That's better than jumping to countermeasures or solutions.
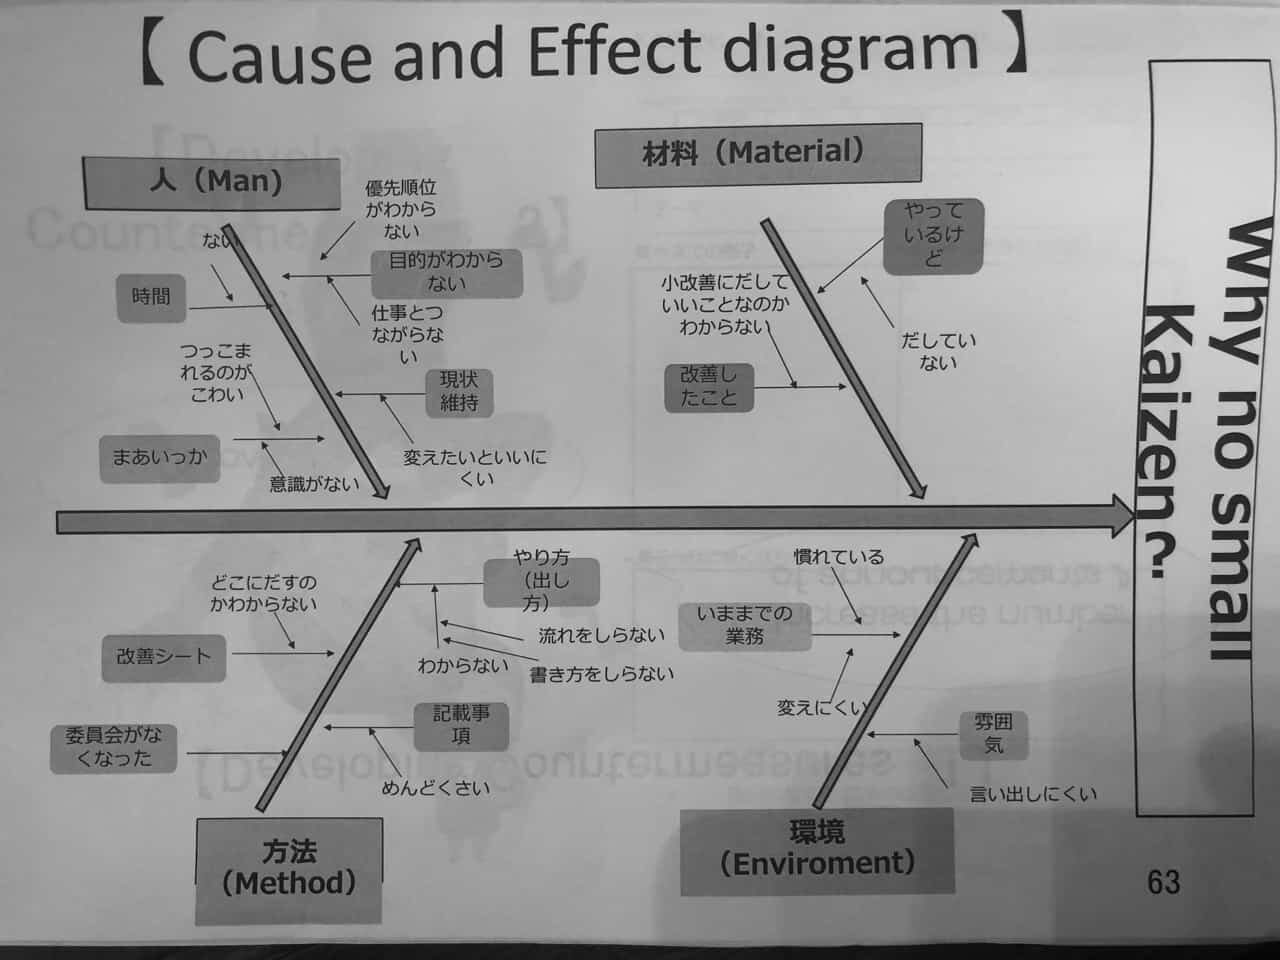
They also created a “fishbone diagram” to look at the various causes of low Kaizen participation:
2025 Update with Details from the Japanese Fishbone
Thanks to advances in ChatGPT, we can understand the fishbone diagram in English:
This is a Cause and Effect Diagram (also known as a Fishbone Diagram or Ishikawa Diagram) in Japanese, titled “Why no small Kaizen?” The diagram is used to identify potential causes of the lack of small, continuous improvements (Kaizen) in an organization. It breaks down the issue into four main categories:
- Man (People)
Causes related to people's attitudes, skills, and behaviors:- Priorities are unclear.
- Objectives are not understood.
- Lack of connection between tasks and the purpose.
- Fear of being criticized.
- Lack of awareness or initiative.
- Tendency to maintain the status quo (resistance to change).
- Material
Causes related to resources or tools:- It is unclear if small Kaizen efforts are acceptable or worthwhile.
- Past Kaizen efforts are not visible or documented.
- People feel they are “doing it,” but in reality, they are not.
- Method
Causes related to processes and procedures:- Uncertainty about where to submit improvement ideas.
- No structured system or committee for handling Kaizen.
- Kaizen forms are perceived as complicated or bothersome.
- Unclear instructions on how to propose or document improvements.
- Environment
Causes related to the organizational environment or culture:- People are accustomed to current workflows (resistance to changing familiar practices).
- The atmosphere does not encourage speaking up.
- It's difficult for people to initiate suggestions due to a lack of openness or psychological safety.
Summary
This diagram explores the barriers preventing employees from engaging in small, incremental improvements. It highlights cultural, procedural, and individual obstacles, emphasizing the need for clarity, psychological safety, and a supportive system to encourage Kaizen activities.
Back to the Story
Since we see only “common cause” variation in the chart, I'm not surprised that there are many causes of variation or lower-than-desired performance.
There's no single root cause to be found.
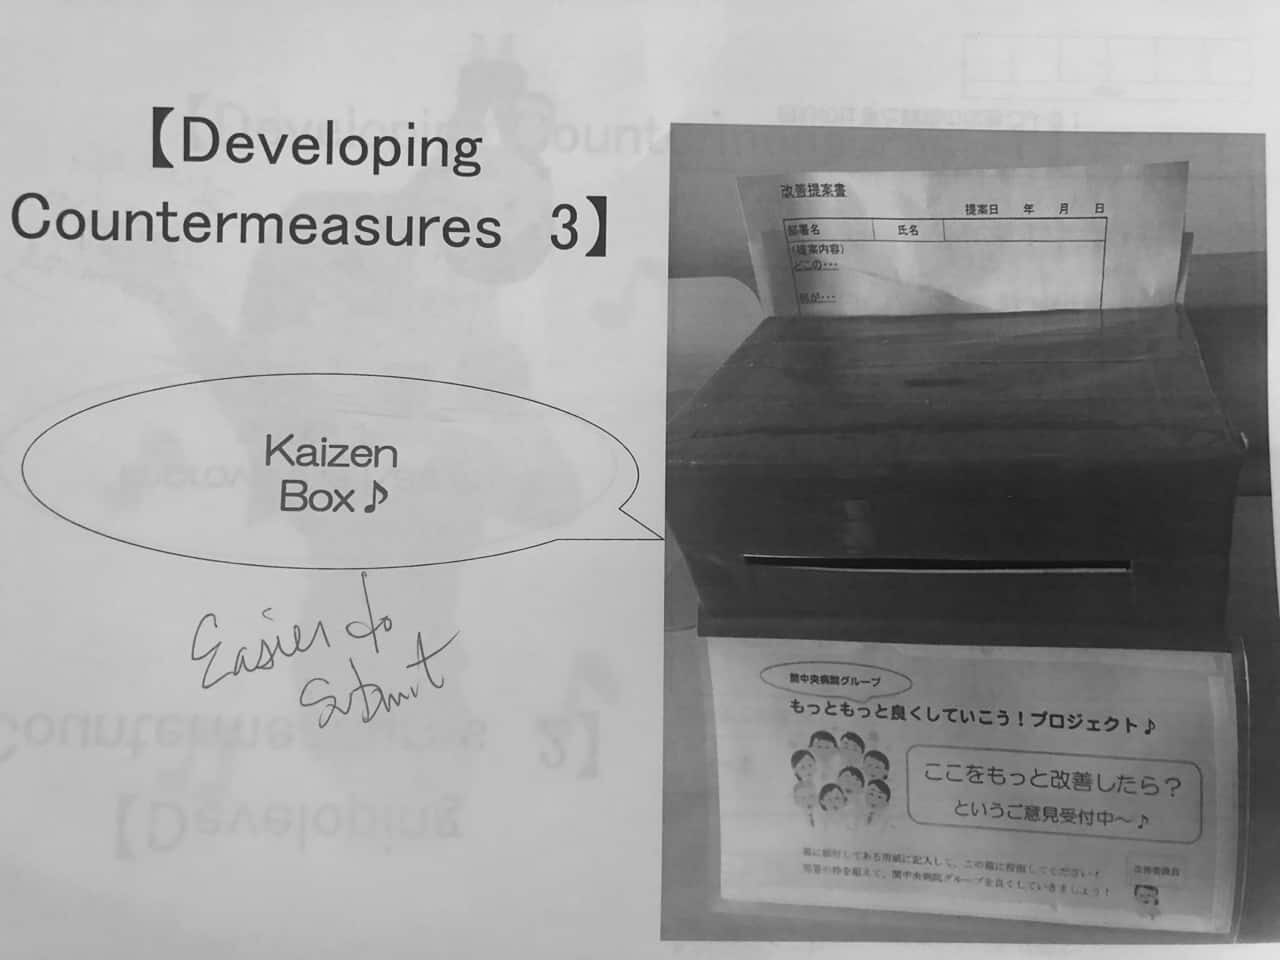
But, they developed at least three countermeasures:
- Increase the number of announcements about the Small Kaizen Contest
- Improve the Kaizen sheet (“the old form was difficult to write”)
- Posting of a “Kaizen Box” (to make them “easier to submit”)
They have to be careful that the Kaizen Box doesn't turn into a traditional Suggestion Box, “where good ideas go to die,” as I've heard people say in the United States.
How Do We Know If the System Actually Improved?
These seem like improvements to the system that I'd expect to boost the average, or at least there's a reasonable hypothesis there.

They only shared one “after” data point. Month 11 went up to 94.
The original Process Behavior Chart tells me, again, that the single data point there is more noise in the system. I wouldn't get any more excited about the month 11 number than I would get upset about the month 10 number.
They were happy though. I love the graphics.
Not to be a buzzkill, but I'd want to see more than one data point to be happy that there was a real shift upward. I'd use the Process Behavior Chart to tell me if there was a shift in performance that amounts to a signal.
What Real Evidence of Improvement Looks Like
Signals that would provide proof of a change to the system are:
- A single data point above the upper limit of 167.45
- Eight consecutive points above the old average of 77.6
- Seeing 3 out of 3 or 3 out of 4 data points that are closer to the upper limit than the average
I'll illustrate that with made-up data (showing just the X chart… the MR chart is still showing no signals):
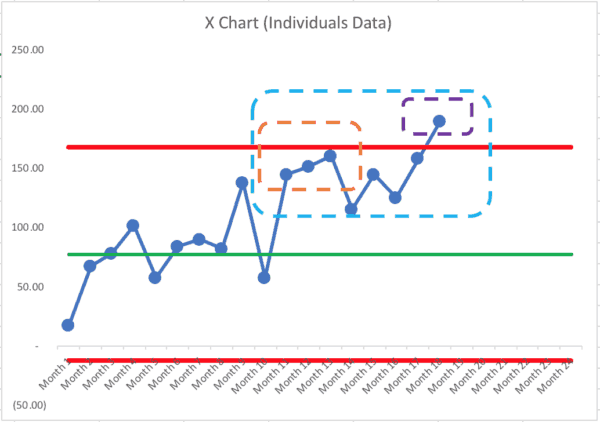
The first signal we see is the three data points in the orange box.
The second signal is the point above the upper limit (marked with purple).
That also makes the eighth consecutive point above the old average (points marked in blue).
We don't always see all three signals. We might just see one.
But this chart shows strong evidence of a performance boost. The number of Kaizens might now be predictable around a new average, as shown below:

The number of Kaizens is now expected to fluctuate around an average of 149, with limits that say it will fall between 82 and 215, unless the system changes again. Again, the scenario above used made-up data for illustration purposes.
Kaizen Metrics as a Reflection of Culture
I hope the hospital was able to improve its Kaizen system. I'm sure they are still working on it.
What were the desired effects of their Small Kaizen Contest?
- “Various improvements have been made
- Establish and nourish the culture that is easy for change
- Contributes to a culture where people can improve while having fun”
As they summarized:
“Kaizen activities contribute in the creation of the workplace where staff can work effectively!”
Are you creating a workplace where staff can participate in improvement? Check out our Healthcare Kaizen books to learn more about how to do this.
Sustainable Kaizen isn't driven by reacting to dips or spikes–it's built by improving the system that makes participation safe, easy, and meaningful.


Good analysis Mark. This phenomenon is peculiar to the de jure world of business and the unrealistic need by leaders for ever-better performance in spite of the facts — meaning, always a step forward and never a step back. Imagine a golfer thinking the same way. Every tournament they played in would have to result in a win with an ever-greater margin of victory until the required winning score is 100 under par. And when the golfer can’t do that and loses a tournament, they get blamed by the coach, sponsors, etc. The difficulty is in breaking leaders’ de jure habit and be more de facto. Lean management offered that opportunity, but only a few leaders saw the benefit and took it.
Focusing the initial question on the number of Kaizens in a month risks sending the wrong message. The implication is that there is some type of goal number for the number of events which in turn leads to management by objectives – “Everyone needs to submit a Kaizen so it looks like we are making an improvement.”
A more relevant question would be “Is the Kaizen submission process making it difficult for people to submit suggestions?” Keeping the questions focused on improvement, and improving how the organization improves, keeps the focus where it should be. Management should still track the number of Kaizens to see if any type of statistically significant process change occurs but that shouldn’t become the focus of management communications.
Great point, Brian. I share the concern about setting a target or a quota for Kaizen activity.
So,I am thinking that Dr Deming’s observation might be “what is the purpose of the system ” My own observation would be ,is the hospital free of any and all medical errors.
That’s indeed a more important question.