


tl;dr: Line charts make trends over time easier to see and interpret, while column charts emphasize individual comparisons and can obscure patterns. For Lean metrics and daily management, line charts are usually the better choice. Process Behavior Charts are the gold standard, though.
It is easy to treat chart selection as a minor detail, but the way we visualize performance data strongly influences how it is interpreted and acted upon.
One common example is the choice between column charts and line charts when tracking performance measures in Lean Daily Management, strategy deployment, and similar management systems.
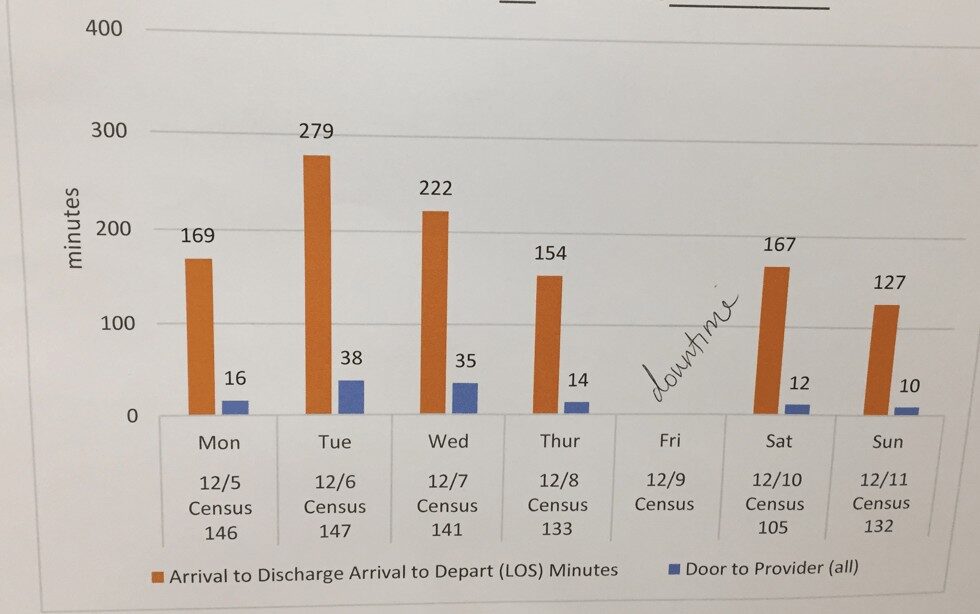
In practice, this choice is rarely intentional. It often reflects habit, default software settings, or examples people have seen elsewhere. During site visits, Lean Daily Management boards are far more likely to display column charts than line charts, even when the data represent performance over time, like this:
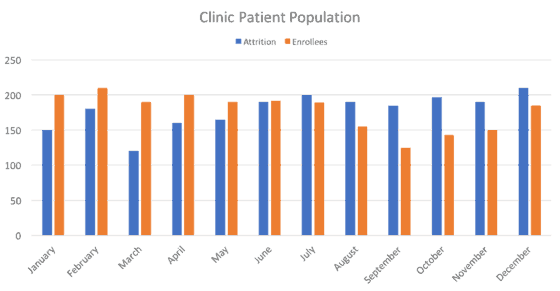
or this:
Most people call them “bar charts,” but the technical term for vertical bars is “column charts” (as they are called in Excel). Bar charts have bars that run horizontally, instead of vertically.
Back to the chart above… don't get me wrong… I'd rather see daily metrics being charted in ANY way, rather than not at all — or being charted monthly, which is far too infrequent to be used for much improvement. This is probably in the category of nitpicking instead of more meaningful criticism – such as the times when people interpret charts badly (one of the themes of today's webinar).

Reminder: You can register to view a recording of the free webinar I presented, hosted by the good people at KaiNexus:
How to Manage Your Improvement Metrics More Efficiently and Effectively
When I was taught to track performance measures, it was always as line charts.
For one, they're easier to draw when done by hand (and I sometimes happily see this in hospitals). It's an outgrowth of drawing Statistical Process Control (SPC) charts by hand on the factory floor (as I saw at GM, even before anything Toyota/Lean was being adopted).
Secondly, I think line charts are better for reading and seeing trends.
I subscribe to the view shared in the helpful book Meaningful Graphs by James M. Smith, PhD.
Smith writes:
“Column charts are primarily used to convey data on discrete categories (hospitals, wards, clinics, etc). They can also be used to display data over time periods but only for a limited number of time periods [up to 8].”
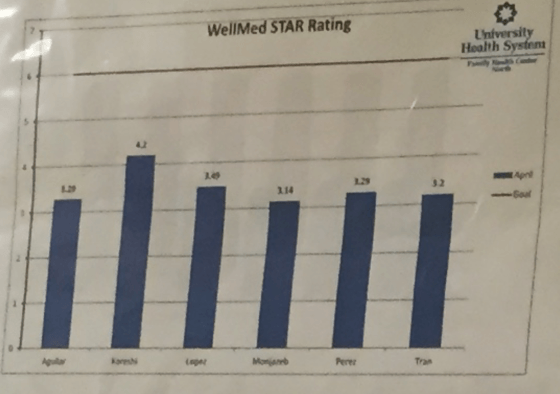
Here is an example of what I think (and Smith would agree) as a good use of a column chart – a static comparison in a point in time… It's a good use of a column chart in the wild, comparing the ratings of (I think) different physicians. Again, this is a snapshot in time, not a time series.
Smith writes:
“Line charts are ideal for showing trends over time or successive events. They can be used for either short or long time periods.”
I agree.
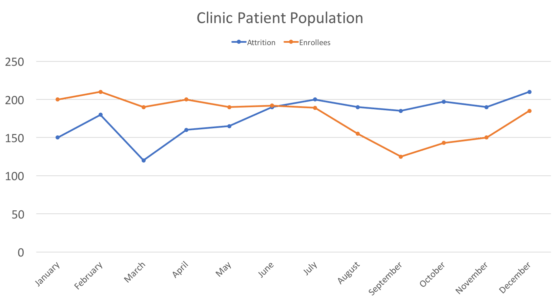
When used to show a time series (or, in this following case, two), I think column charts do more than just waste printer ink. I think they hide and mask trends that we need to carefully evaluate and react to (again, as I'll discuss in today's webinar).
If you're using column charts, I'm not condemning you (again, the interpretation over time is more important). You might have been taught to do it that way. Or, you saw examples.
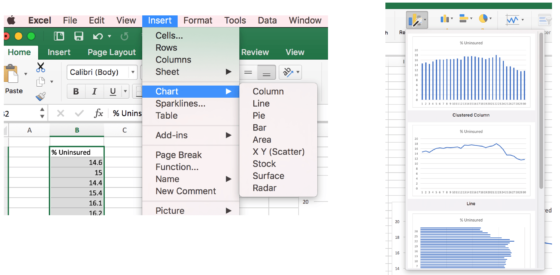
Excel takes some blame, as it nudges you to create column charts, since that option is listed before the line chart option in the top menu or the chart “wizard.”
I think a line chart shows trends much more clearly if we're going to “eyeball it.”
Better than “eyeballing it” would be the use of relatively simple statistical methods, as I'll discuss in today's webinar.
Or check out my book Measures of Success to learn more.
What do you use or see in charts in your organization? Column charts or line charts?
Do you think it makes a big difference in seeing trends and interpreting the charts? Is this post a big deal over nothing?
Line Charts and Process Behavior Charts
Line charts are a step in the right direction, but they're not the destination. Simply connecting the dots doesn't tell us whether a change is meaningful or just “routine variation” in the system. That's where Process Behavior Charts add real value (see my book for more on this).
By adding a center line and statistically derived limits, a Process Behavior Chart turns a basic line chart into a learning tool. It helps teams distinguish “common cause variation” from true signals, reducing knee-jerk reactions and focusing improvement efforts where they actually matter. This is especially important in Lean daily management, where the goal is not to react faster, but to react more wisely.
Column charts can still be useful for snapshot comparisons across categories. But when we're trying to understand performance over time, line charts–and better yet, Process Behavior Charts–support better questions, better conversations, and better decisions. If we want metrics that drive learning instead of noise, the way we visualize data matters more than most organizations realize.
How to Create a PBC for the Number of Enrollees
Here are the steps (also see this other video I did on creating PBCs):
Going One Step Further: Turning This into a Process Behavior Chart (XmR)
A line chart is a better choice than a column chart when we want to understand performance over time. But it is still only a first step. If the goal is to manage a process rather than react to individual data points, we need more context. That is where a Process Behavior Chart, often called an XmR chart, comes in.
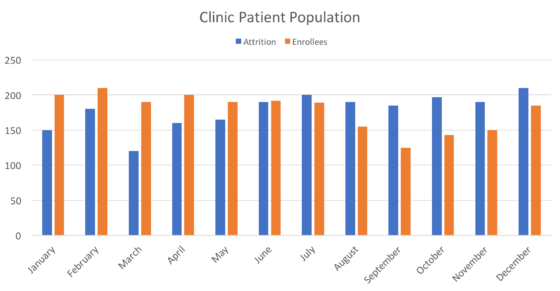
Using the enrollees data from the line chart above, here is how this works in practice.
Step 1: Start with time-ordered data
First, estimate the monthly enrollment values from the chart and list them in the order they occurred. Exact precision is less important than preserving sequence.
| Month | Enrollees (estimated) |
|---|---|
| Jan | 200 |
| Feb | 210 |
| Mar | 190 |
| Apr | 200 |
| May | 190 |
| Jun | 195 |
| Jul | 190 |
| Aug | 155 |
| Sep | 125 |
| Oct | 145 |
| Nov | 150 |
| Dec | 185 |
Step 2: Calculate the moving ranges
Next, calculate the absolute month-to-month changes. These values are called moving ranges. They show how much the system typically shifts from one period to the next.
| From Month | To Month | Moving Range |
|---|---|---|
| Jan | Feb | 10 |
| Feb | Mar | 20 |
| Mar | Apr | 10 |
| Apr | May | 10 |
| May | Jun | 5 |
| Jun | Jul | 5 |
| Jul | Aug | 35 |
| Aug | Sep | 30 |
| Sep | Oct | 20 |
| Oct | Nov | 5 |
| Nov | Dec | 35 |
Step 3: Calculate the averages
Now, calculate the averages used for the XmR chart.
Average enrollments (X bar):
(200 + 210 + 190 + 200 + 190 + 195 + 190 + 155 + 125 + 145 + 150 + 185) / 12
= 2,135 / 12
= 177.92
Average moving range:
(10 + 20 + 10 + 10 + 5 + 5 + 35 + 30 + 20 + 5 + 35) / 11
= 185 / 11
= 16.82
Step 4: Estimate sigma and calculate the limits
For an XmR chart, the process variance (sigma) is estimated using the average moving range divided by a constant of 1.128.
Sigma estimate:
16.82 / 1.128 = 14.91
The Individuals chart limits are then calculated as plus and minus 3 sigma from the average.
3 sigma:
3 x 14.91 = 44.73
Now calculate the limits:
Upper limit
177.92 + 44.73 = 222.65
Lower limit
177.92 – 44.73 = 133.18
| Measure | Value |
|---|---|
| Average (X bar) | 177.92 |
| Estimated sigma | 14.91 |
| Upper limit | 222.65 |
| Lower limit | 133.18 |
Step 5: Interpret the XmR chart
Looking at the Individuals chart, the late summer drop in enrollment appears dramatic. In a column chart or even a simple line chart, that visual drop almost demands explanation and action.

The Process Behavior Chart adds critical context.
With the plus and minus 3 sigma limits in place, only one data point, approximately 126 enrollees, falls below the lower limit. That point is a signal of a possible special cause and deserves investigation. The other points, including those that look concerning in a simple line chart, fall within the expected range of variation for this system.
This distinction matters.
Most of the visible ups and downs reflect routine variation. One point below the lower limit suggests a meaningful change worth understanding
The XmR chart helps separate noise from signal. Instead of treating every dip as a crisis, it directs attention to the one data point that statistically stands out and is most likely to teach us something about the system.
Here's the MR chart, by the way — no signals to be found there since every point is below the calculated upper limit.

Note: In practice, the XmR chart methodology usually focuses on the X Chart — and we'll leave it at that for now.
What not to do when a point falls outside the limit
When a single data point falls outside the plus or minus 3 sigma limits, the worst response is to treat it as a performance failure or to immediately implement a corrective action. Do not adjust targets, rewrite standard work, or pressure people to “fix the number” without understanding what actually changed in the system. One signal calls for investigation, not reaction. Acting too quickly can add more variation, hide the real cause, or discourage people from being honest about what happened. The goal is learning, not containment.
Step 6: Shift the management conversation
Once the Process Behavior Chart is in place, the management conversation changes in a very practical way.
Without this context, leaders often feel pressure to explain or react to every rise and fall in the data. That leads to firefighting, second-guessing, and frequent changes that do little to improve the underlying system.
With the XmR chart, attention is directed where it belongs. Most of the data points reflect routine variation and do not require reaction. The one point that falls below the lower limit does merit investigation, not blame, but curiosity. The question is not who caused the problem, but what was different in the system at that time.
Routine variation –> manage the system
One signal point –> study and learn
This approach reduces unnecessary reactions while increasing the quality of learning. It encourages leaders to focus on improving capability and reducing variation, rather than chasing individual data points. Over time, that leads to more stable processes, better decisions, and more meaningful improvement work.
Why this matters
Chart choice is not a cosmetic decision. It shapes how people think, what they react to, and where they focus their improvement efforts. Column charts tend to invite comparison and judgment. Line charts preserve time order and make trends easier to see. Process Behavior Charts go further by adding the context needed to understand variation and avoid false signals.
This example shows that better charts lead to better conversations. Instead of reacting to every up and down, leaders can distinguish routine variation from meaningful change and respond accordingly. That shift reduces overreaction, supports learning, and helps teams focus on improving the system rather than explaining individual results.
If the aim of Lean daily management is better decisions and better learning, then the progression from column charts to line charts and eventually to Process Behavior Charts is a practical and accessible upgrade. It is a way to manage with greater clarity, less emotion, and a sustained focus on improving how the system performs over time.
Please scroll down (or click) to post a comment. Connect with me on LinkedIn.
If you’re working to build a culture where people feel safe to speak up, solve problems, and improve every day, I’d be glad to help. Let’s talk about how to strengthen Psychological Safety and Continuous Improvement in your organization.


Mark
I agree with you and with Jim Smith. Plotting time series data in columns just makes interpreting harder. I ask delegates on my courses to notice where their eye ends up when they just look at a column chart. They often say ‘in the middle’. I think that’s because the long vertical lines take precedence in our brain. So we have to fight our natural inclination if we want to track the top of the column to follow any trends.
Good explanation, Mike. I’ve had trouble articulating why columns are harder to interpret. A dot or point in a line chart draws your eye to that. With a column chart, the number is an edge of… like you say… a really tall column that draws your eye.
It seems like a line chart could be better so you can visually incorporate a target, or a specific number where it triggers additional action (IE root cause analysis)
Do you include upper and lower standard limits on your charts? Or include ranges for acceptable or historical ranges of variation?
If so I think a line chart would be more visually efficient to include those targets. You could quickly discern your process performance levels and it would be easy to tell if it has somewhat acceptable, fantasic, or unacceptable performance.
I’ve always found Tufte’s data-ink principle useful in this case. His principle would suggest that the only valuable ink on the column chart is the ink comprising the top of the column, as it’s the only portion that represents data (kind of like it’s the only value-added portion of the ink and the rest of the column is “waste”). A line chart uses a lot less ink and more efficiently represents data. Less wasteful ink can create more simple and elegant displays of data (not always but probably true in this case)
Line charts are the way to go to understand what is happening in the process or system over time. This is a key issue in organizations stuck in the prevailing management mindset. additionally line charts are the most effective way to also create control charts in order to better understand the stability of the system and the nature of the variation: common cause or special cause and thus the more likely appropriate response. (=change the system most of the time). bar charts can be used for static deep dives to ascertain prime contributors to the problem. i.e. 80/20 rule.
Thanks for your comment.
You’re right that using line charts instead of column charts is just the first step… they have to be managed properly.
That’s why I put together the webinar mentioned in this blog post.
Comments are closed.