

Today's Post in <50 Words: Are “visuals” and “visual management” the same thing? Are “visuals” always Lean, necessarily? In this post, I talk about the differences using an example from a hospital and my car's dashboard.
In 2015, I wrote a post titled “Moving from “Visuals” to “Visual Management” and to Broader Lean Thinking” that laid out how I view the difference between “visuals” and the Lean concept of “visual management.”
I often see confusion in how those terms are used. Many times, a “visual” (also called a “visual indicator”) is labeled as “visual management” in a way that doesn't really capture the Lean thinking behind the term.
As I said in that 2015 post:
To me, the core of visual management is captured in this statement from Fujio Cho, now the honorary chairman of Toyota:
“Know normal from abnormal… right now!”
Charts on the wall in your department might be just a visual… or if you're using SPC methods, it might help show the difference between normal from abnormal (and this isn't always a comparison of performance versus a goal).
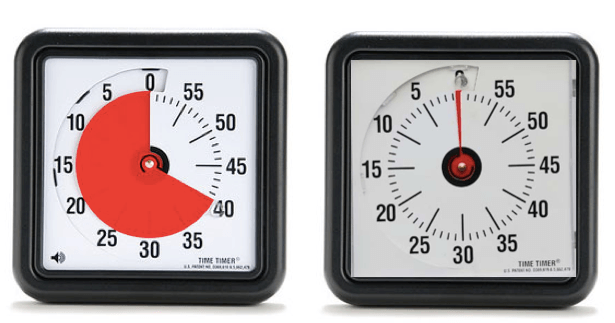
This older blog post of mine talks about this and provides some good examples of “visual management,” such as these clocks that can provide a visual to see if a patient has been rounded on in the past hour. A fully white clock face, on the right, shows that a patient hasn't been rounded on… an “abnormal” condition to be investigated or addressed.
Is it a Visual or Visual Management?
Recently, I saw somebody post this and describe it as an example of “visual management.”
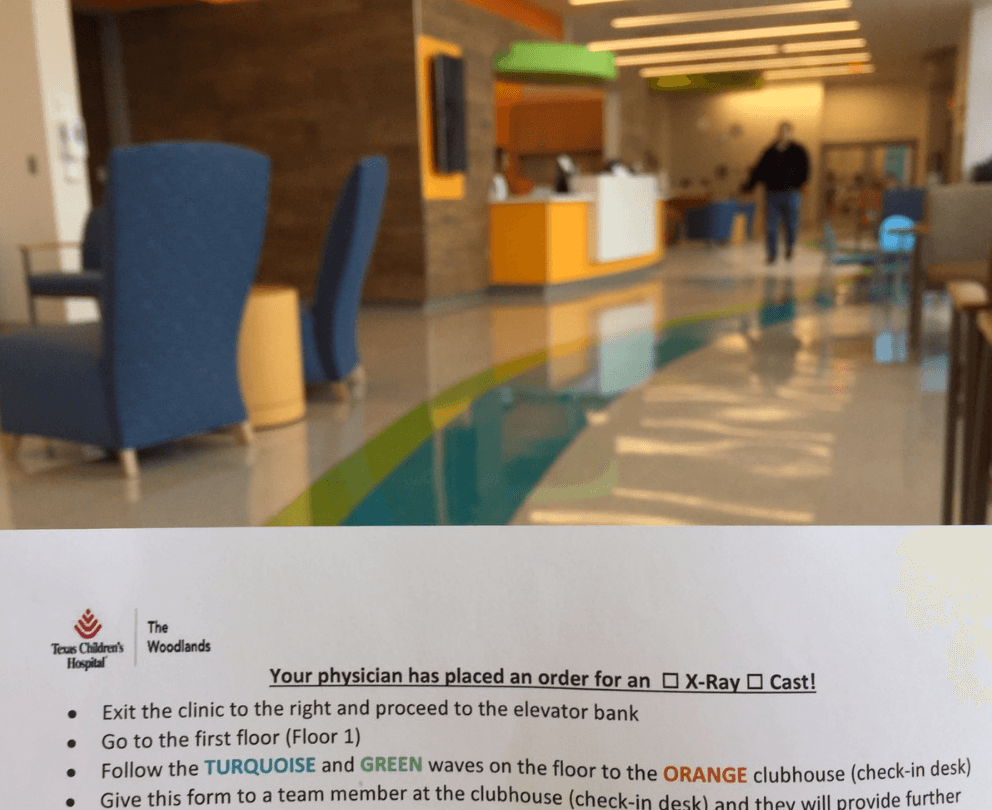
To me, that's better described as a “visual.” It's helpful and a good thing… but those waves and lines on the ground don't help us see the difference between “normal” and “abnormal.” There's nothing to “manage” there, so it's probably not “visual management.”
I'm not sure why an “orange” clubhouse doesn't have orange lines headed toward it.
What's an “abnormal” condition you might need to manage? Patients or family members getting lost might be an example.
Let's say a patient was headed toward an orange clubhouse… would you give them an orange shirt to wear? An orange sign to hang around their neck or to carry?
If you saw an “orange” person walking down the yellow pathway, somebody could “manage” the situation based on the visual… they could intervene and ask if the person is lost.
That's not happening here… so, again, I'd call that a “visual” not “visual management.”
A “Visual” from My Car
My car can display a lot of information on the dashboard… thankfully, not too much information all at once.
As I shared on Twitter, what's showing here is another “visual.” It's not visual management.
This is a "visual." It's only "visual management" if it highlights an abnormal condition & you react to it. #Lean pic.twitter.com/hxAgFWYcnX
— Mark Graban (@MarkGraban) February 10, 2017
This visual shows me the air pressure of each of my tires, in psi. The visual is helpful in that I can easily tell which number corresponds with which wheel. They don't have to label the numbers with words.
The thing that keeps this from being “visual management” is that there's no indication about whether the numbers are in the normal range. The front tires are supposed to be at 32 and the rear tires at 35.
One of those numbers is higher (not significantly so).
It would be more “visual management” if some of the numbers turned red if they were out of the normal range (but, we'd have to worry about red/green color blindness).
Visual management helps you make decisions and respond. It would really be “visual management” if I reacted to the numbers and added add if the pressure was too low (not just watching the visual).
Now, the car does display a special warning if any tire is so underinflated that it might be dangerous. We wouldn't want an annoying alarm every time the front pressure hit 31 or 33 psi. There's always some variation and there's not a problem caused by being a little bit off from the desired number.
Another Visual That's Far Less Clear
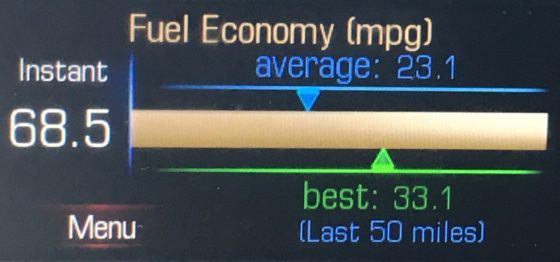
If I get tired (no pun intended) of displaying the psi, I can have the car display my average fuel economy. I can display it as a big number (24.6 mpg) or I can look at this super confusing graphic:
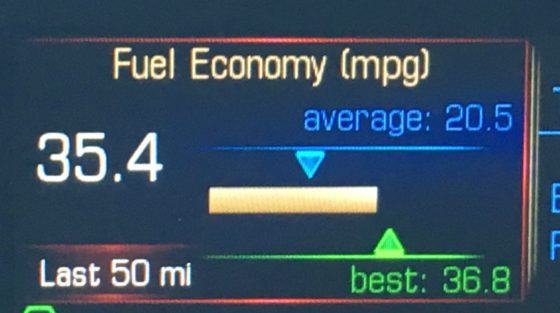
The 35.4 number means the CURRENT fuel economy. That number, and it changes frequently, is also visualized by the yellow bar.
The “Last 50 mi” label is white, like the 35.4 number… and it's right below it… but it doesn't correspond to it. I think the label refers to the chart.
I don't know know for sure what the “average” of 20.5 represents. That's probably what the “Last 50 mi” refers to. I'm averaging 20.5 mpg for the last 50 miles?
I think the green triangle and number means that my best mileage over any period of 50 miles, ever, was 36.8 miles (I must have been driving downhill on a freeway).
I'll play car designer and suggest the visual would be much more clear if it was like this:
What do you think of these examples?
Do you have examples of visuals that get mislabeled as “visual management?”
Do you have good examples of visual management from your workplace you can share or describe?
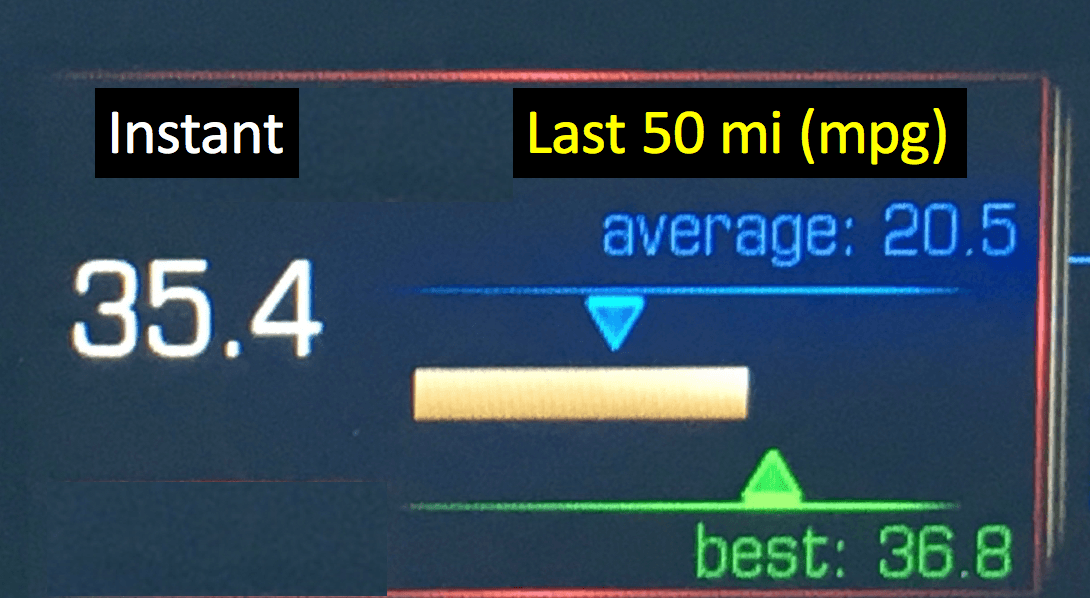
Update: After I wrote this post, I had a rental car that was a newer version of my car (and slightly bigger). Here was it's visual:
I noticed they put “Instant” above the white number. They also moved the “Last 50 miles” to be under the chart. Maybe that's more clear?
What do you think? Please scroll down (or click) to post a comment. Or please share the post with your thoughts on LinkedIn – and follow me or connect with me there.
Did you like this post? Make sure you don't miss a post or podcast — Subscribe to get notified about posts via email daily or weekly.
Check out my latest book, The Mistakes That Make Us: Cultivating a Culture of Learning and Innovation:


Comment from LinkedIn:
Hi Mark, just to clarify, tire pressure indicator numbers shown here are supposed to turn red colour when abnormal. I can appreciate the automaker not showing the abnormal values to help on readability. Good article though, great idea getting patients to wear colour item indicating destination.
Hi, Mark. Good post. This has made me think about how I manage my own visuals. One of my challenges is that I think the visual is displaying something abnormal, but the organization thinks its simply normal. For example, I use a Kanban board and it regularly indicates too much work in progress, but my organization doesn’t have a problem with large work limits. Also, my charts may show abnormality (ex. enormous variation, behind schedule etc), but there seems to be little we can do about it. Still, I am going to think more along these lines. I hadn’t thought of it like this before. Curious–what do you think of RAG reporting?
Hi Dan –
Thanks for your comment. I’m not familiar with “RAG reporting.”
You raise a good point that the organization needs to agree on what “abnormal” and “normal” are. That might be different than defining what’s “acceptable” or “unacceptable.”
Mark
So RAG Reporting = Red Amber Green status reporting.
I guess that’s fine, but the problem is the tendency to low ball estimates or misrepresent status so things looks green. There’s a famous Alan Mullaly story from when he became CEO of Ford.
This article has the story
Hello Mark,
This post is really informative and clear with your example.Could you suggest me some latest technologies in visual management.
Hi – Not sure what you mean by “latest technologies” for visual management. Visual management is a concept more than a technology.
Visual management could be tape on the floor showing, for example, that if that many customers are waiting in line, then management should respond by opening another registration desk by shifting somebody over from another area.
I mean to say the visual management tools like process map,kanban (Visual flow management) these are some traditional tools for visual management.I asked about any latest Information technological(IT)innovations for visual management like VDR(visual display record ) which helps to track the project status.
Again, I’d try to emphasize that visual management is not just about “visual displays” of information. Charts and metrics can be done on paper, spreadsheets, systems like KaiNexus, etc.
But, showing status alone isn’t “visual management.” Visual management means making problems visible and responding to them in appropriate ways.