Search Results for spc understanding variation

Look Out! That ‘Out of Control’ Chart Might Not Be What You Think

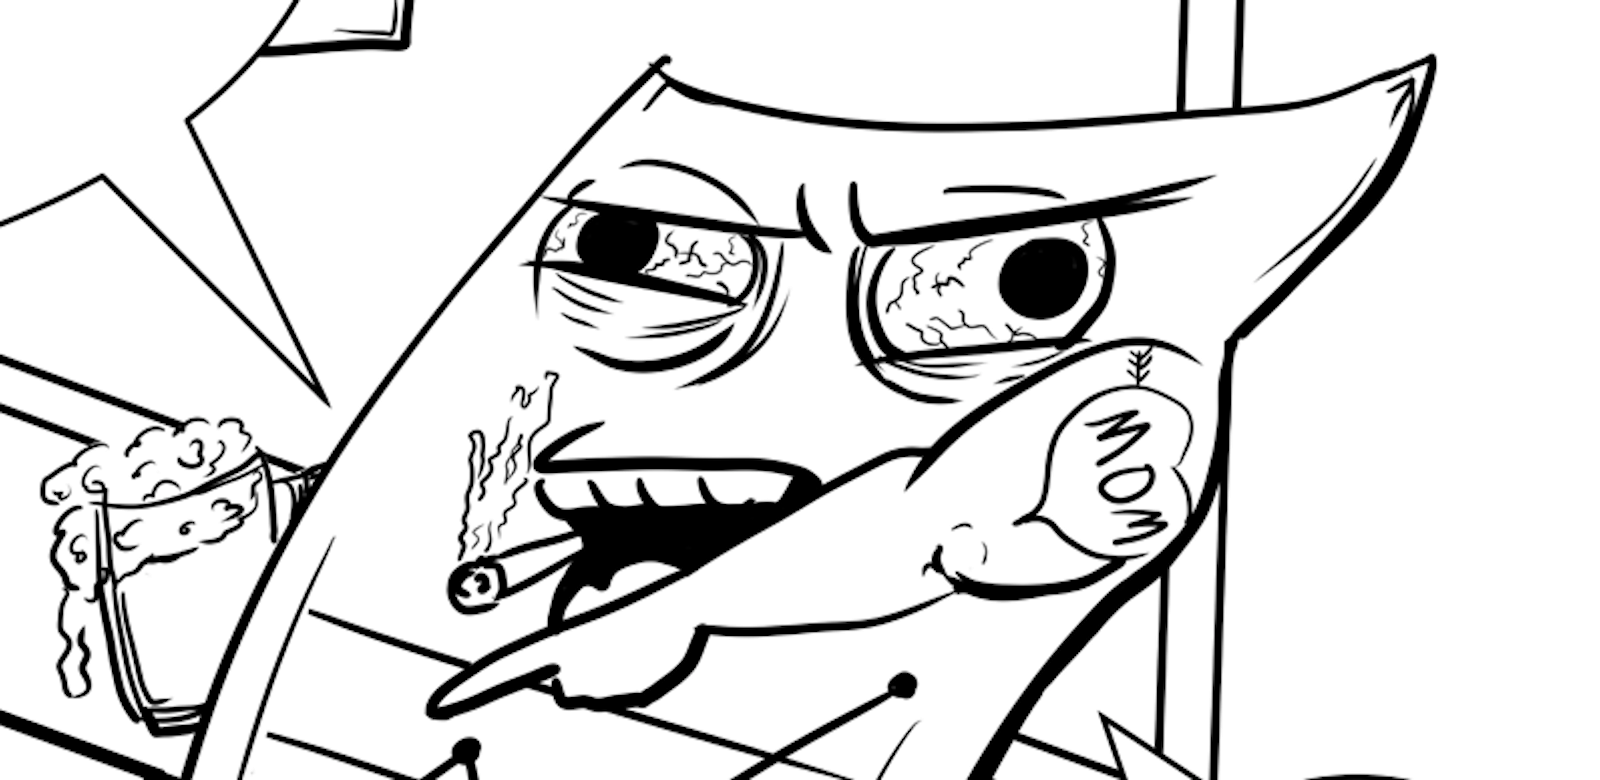
Here's the latest cartoon collaboration with a skilled artist and medical assistant, Carrie Schurman (see past cartoons). You can find her on Twitter as @carrieschurman.

The idea for this cartoon came from Maggie Millard, the director of marketing at KaiNexus. Maggie has learned about Process Behavior Charts from me and some of the stories are incorporated into my book Measures of Success. 

What does this "out of control chart" look like and why did it make me chuckle?

My Article for the LEI “Lean Post”: React Less and Improve More…

It's been a while since I've contributed something to the Lean Enterprise Institute's online publication, The Lean Post (see past articles).

Today, they're allowing me to introduce some ideas from my book Measures of Success. Many "Lean thinkers" just haven't been exposed to these ideas. Many haven't read Deming or Wheeler... it's not their fault for not knowing of Process Behavior Charts and methods like this.

But, I hope this post helps people see that "bowling charts" and "red/green" analysis are not the only way (or the best way) to look at metrics.

My article:

"React Less and Improve More by Using SPC More Effectively"

Stop Overreacting to Metrics: Lessons from Lean Startup Week

Thanks to Eric Ries and the organizers for Lean Startup Week for allowing me to share video of my 15-minute talk from last year's event.

One reason for sharing this today is to celebrate yesterday's initial release of the in-progress version of my book Measures of Success. If you buy the book now, you'll get a PDF of the first three chapters, or about 40% of the book's expected content.

An AI that won't just give you the answer. That's what makes it useful.Free Demo -- Learn More
+ +
lean coach ad