Red is a color that grabs attention–and in many workplaces, it sparks fear. It's the color of missed targets, late projects, and angry charts in management reviews. But what if we've been thinking about “red” all wrong?
For decades, I've seen how organizations react to red with blame, pressure, and firefighting. I've also seen how this mindset leads to hidden problems, distorted data, and wasted energy. But there's a better way.
In this post, I'll explore three different mindsets about “red” in performance metrics–from fear and shame… to opportunity… to a deeper understanding of variation that reveals what really matters. If you're tired of jumping to conclusions and chasing every red dot on your dashboard, read on.
Mindset #1: Red Means Failure (And Why That's Outdated)
Traditionally, “red” is something that get punished in some way. When I started working at General Motors 30 years ago (yikes, 30!), there was a lot of yelling, blaming, and screaming. And some cursing.
There wasn't a lot of encouragement in the “you can do it” spirit. It was more along the lines of, “What's wrong with you people?” and “You need to do better or else.”
In a fear-based environment, people are tempted to game the system or fudge the numbers–when that's easier than actually improving the system that's generating the results.
Mindset #2: Red Reveals Opportunity (If You Let It)
Many organizations, often under the banner of Lean management, work on shifting the mindsets from “Red is bad, so it must be punished” to “Red is good (in a way) because it shows us our opportunities for improvement.”
This example is about project status, but there's a famous story about Alan Mulally, when he was still the new CEO at Ford (after being brought in from Boeing). The status of everything was being reported as green. But the company was “in the red”–losing a lot of money.
So Mulally had to shift the culture to encourage leaders to be candid. And, he rewarded that candor and was constructive about it:
When one manager offered up the poor performance of his unit, some Ford executives were stunned by Mr. Mulally's reaction. He applauded, saying: “Great visibility.” Mr. Mulally coached his team on using the colored graphs and lists. “We got to the yellows and the reds pretty quickly…within a month,” the CEO says.
When a color improves, “it's a chance to celebrate,” he adds.
It's not great that our metric or status isn't meeting the target. But, a culture of punishment and fear drives problems underground. We can't solve a problem that isn't visible and known.
So I wouldn't go so far as to say we “celebrate the red”–but we can embrace the red as the real reality… and we can embrace that as the starting point for improvement.
Mindset #3: When Red Becomes Irrelevant (The Power of Process Behavior Charts)
This is a topic I've written about a lot here on the blog. Too many leaders get sidetracked by reacting to every red data point (or waiting to react to two consecutive reds). When managers or executives demand a root cause analysis, it could be a waste of time if the red data point is part of the “common cause variation” (or “routine variation”) or fluctuation in a metric.
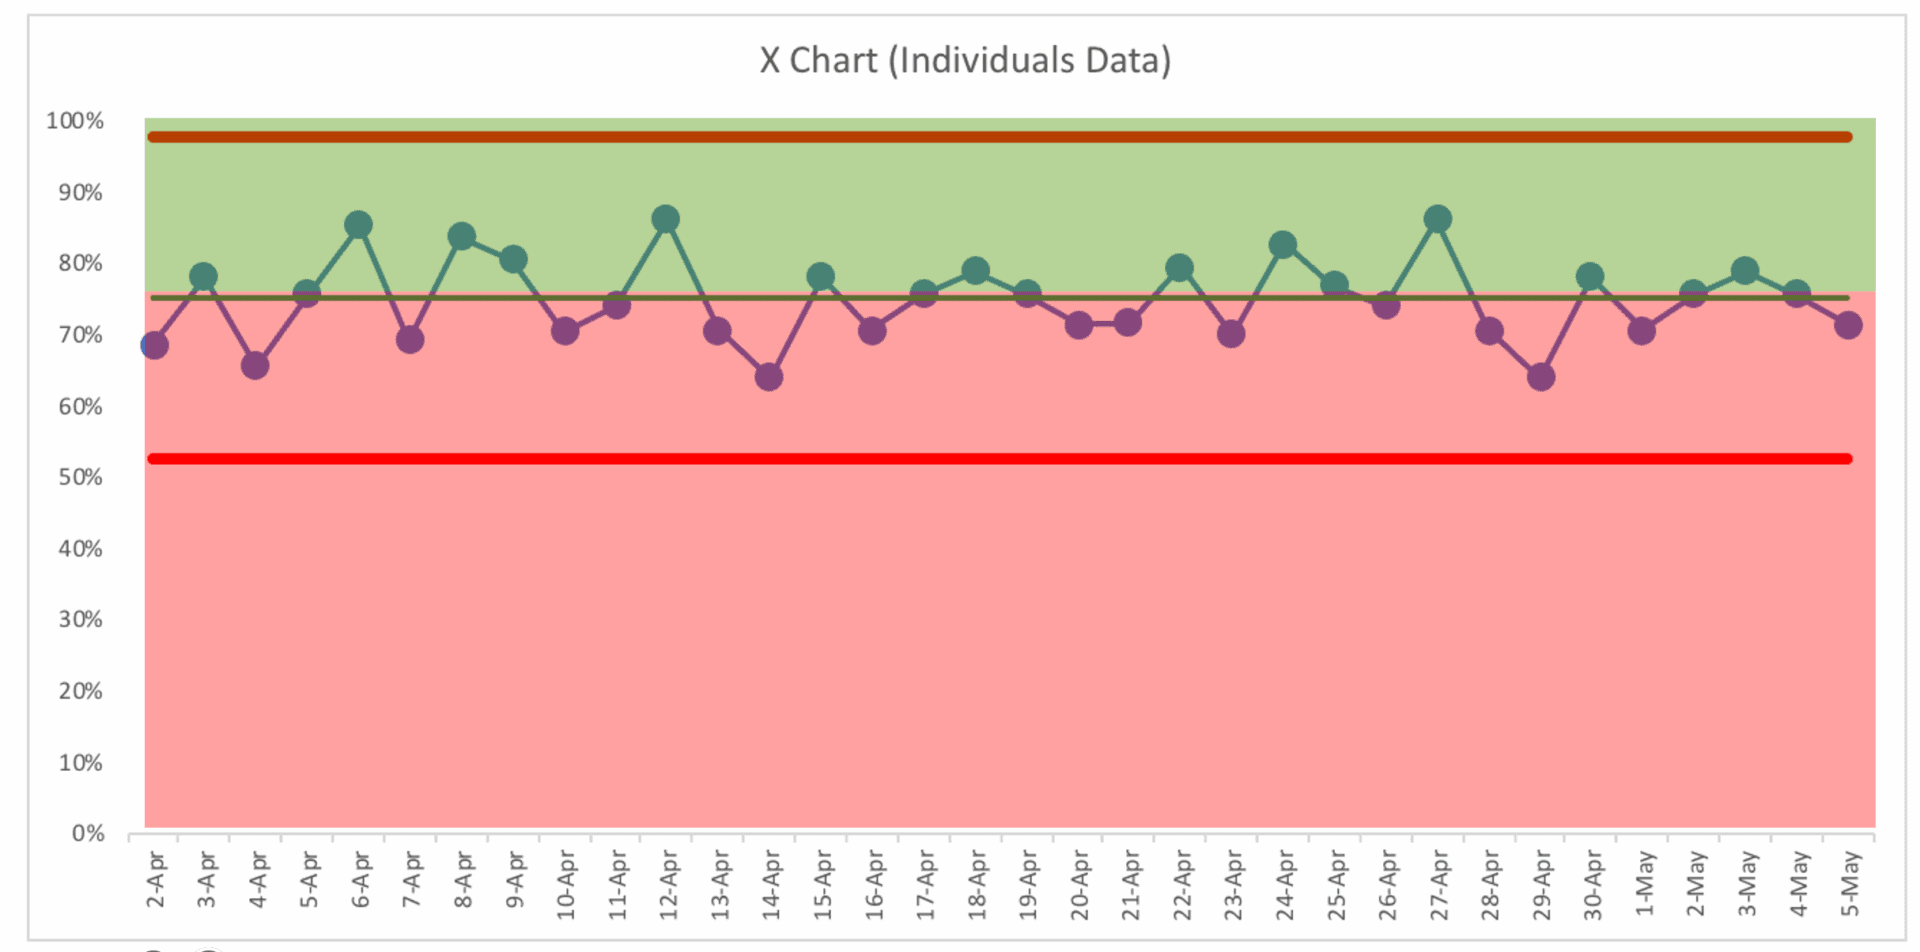
Here's an example where the average performance of the system is very close to the target that was set by management:
None of the red data points seen in that chart, representing a “stable and predictable system” is worth reacting to in and of itself. These red data points are “noise”–just as the green data points are.
That chart is a “Process Behavior Chart” with a lower limit and an upper limit (the red lines) that are calculated based on the system's baseline performance and variation.
The time to react and do an RCA (via A3 problem solving or other methods) would be any data point below the lower limit that's about 53%. Or we'd need to react if we had eight or more consecutive data points on the same side of the average. But we don't see that.
Each data point here is “noise.”
So what can we do? Instead of being super reactive, we need to take a step back and be more systemic.
Instead of framing the problem as, “That data point is red, so let's figure out why,” the problem should be stated as, “Our performance is predictable, but not capable of always hitting the target–so how do we improve the system in ways that improve performance and even reduce variation?”
Key Takeaways:
Red doesn't always mean “bad”–it might just mean “normal variation.”
Culture matters: fear drives hiding, but candor drives improvement.
Process Behavior Charts help you distinguish between signal and noise–so you don't waste time chasing the wrong problems.
Conclusion: Don't Fear the Red–Learn From It
Too often, we get caught in a reactive cycle–treating every red metric as a crisis and missing the bigger picture. But red isn't always bad. It can be a signal. It can be noise. And most importantly, it can be an opportunity–to learn, to improve, and to lead better.
Shifting from fear and blame to systems thinking and true understanding isn't easy. But with the right tools and mindset–like Process Behavior Charts and a solid grasp of variation–you can stop chasing every red dot and start focusing on meaningful improvement.
Want to Dive Deeper?
If this post resonated with you, you'll find even more practical guidance in my book Measures of Success: React Less, Lead Better, Improve More. It's a roadmap for any leader who's tired of the performance rollercoaster and wants to create a culture that thrives on learning, not fear.
I offer workshops and keynotes for teams and organizations who want to stop overreacting and start improving–based on proven methods and real-world case studies. Whether you're just getting started or deep into your Lean journey, I can help.
Please scroll down (or click) to post a comment. Connect with me on LinkedIn.
Let’s build a culture of continuous improvement and psychological safety—together. If you're a leader aiming for lasting change (not just more projects), I help organizations:
Engage people at all levels in sustainable improvement
Shift from fear of mistakes to learning from them
Apply Lean thinking in practical, people-centered ways


