


The Oscars may report a “four-year high” (or now, in 2026, a “four-year low”), but the long-term data tells a very different story. Year-to-year viewership and ratings changes are mostly noise. Using Process Behavior Charts reveals the real trend: decades of decline driven by systemic shifts–not hosts, movies, or one-off events.
Yes, the 2025 Academy Awards drew slightly more viewers than last year. That fact is technically correct.
Now, the 2026 Oscars drew slightly fewer viewers than the year before. Also technically correct.
Year-over-year comparisons like this often confuse noise for improvement and encourage misleading narratives about success.
When we step back and look at the Oscars' viewership over time, a very different pattern emerges. Using long-term data–and Process Behavior Charts instead of cherry-picked comparisons–we see decades of decline driven by systemic changes in how people watch television, not by hosts, start times, or one-off pop culture moments.
Context matters. Without it, headlines tell comforting stories instead of useful ones.
Why “Four-Year High” Oscars Ratings Headlines Are Misleading
You might have read a very similar post in the past… because I've written very similar posts (like this one updated in 2021), and I wrote about this in my book, Measures of Success.
I'm going to pick on the New York Times (with a free article link):
‘Barbenheimer,' and an Early Start, Boost Oscar Ratings to 4-Year High
It's a true statement. It's factually correct to say TV ratings in the U.S. were a “4-year high.” Is that worth celebrating? The context around the data… and what we learn from having more than four data points matters greatly. That's a lesson for the Academy of Motion Picture Arts and Sciences, ABC television, or any business.
“ABC's telecast of the 96th Academy Awards on Sunday drew 19.5 million viewers, hitting a four-year viewership high, according to Nielsen. The live TV audience was up from last year's 18.8 million, the third consecutive year that Oscar viewership has grown.”
It's true that the number of viewers was higher than last year. One could do the math, as these articles do — it's a 3.7% increase from 2023.
That's true, but is it statistically meaningful? What conclusions should you draw, if any?
It's true that ratings have increased for a third consecutive year. That makes this year, yes, a four-year high.
True, but meaningful?
Here's a chart that I drew showing these last four years:
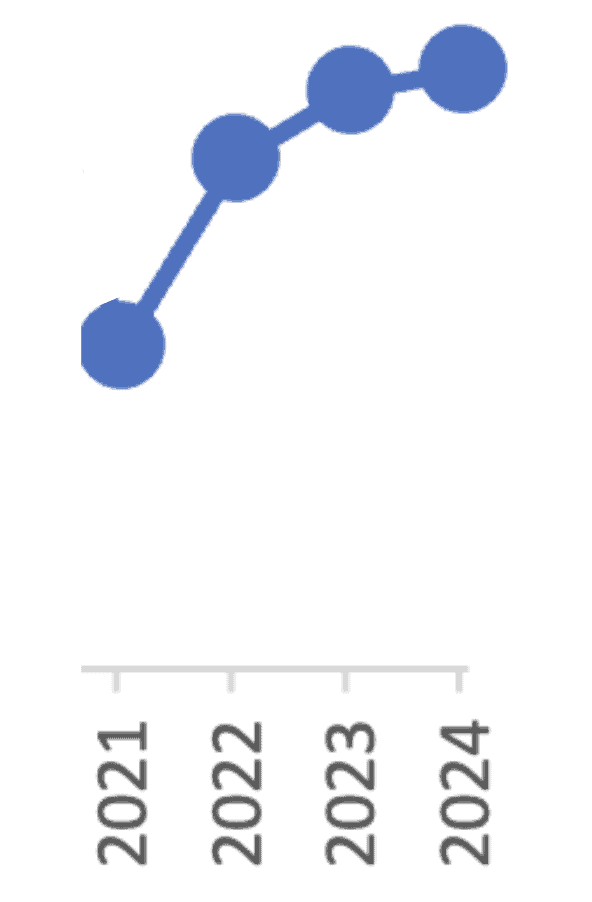
The chart reminds me of this scene from The Simpsons where Disco Stu looks at projections for disco record sales:
“If these trends continue…”
Oscars viewership isn't showing an exponential increase like Disco Stu's cherry-picked numbers. It seems to be approaching an asymptotic limit of about 20 million viewers. Should the Academy and ABC be happy about that?
As usual, the Times' article tries to explore reasons why ratings might be higher, including:
- Starting the broadcast an hour earlier
- Popular movies are being nominated (and history shows ratings are higher in these years)
- People are happy with Jimmy Kimmel hosting for a fourth time (see this blog post about hosts and ratings)
The Times also shares data that is factually correct… but possibly not meaningful:
- The 2024 Oscars was the most-watched major awards show since February 2020
- The Grammys' viewership was up 34% compared to last year (so the Academy and ABC should be upset at their comparative performance?)
- The Golden Globes' ratings were up 50% year on year
- The Tonys' ratings were up about 10%
- The Super Bowl “beat ratings records”
So are the Oscars part of a positive trend about live event viewing? Or are the Oscars underperforming compared to other live-event viewing growth?
Context matters.
The Oscars are not at an all-time high in ratings. Far from it!
The Times explores the history and context a bit. But not as much as I would.
“In 2021, for a stripped-down pandemic Oscars held in a Los Angeles train station, only 10.4 million people tuned in. Viewership rose in 2022 to 16.6 million people, in part because of the bizarre spectacle of Will Smith slapping Chris Rock.”
Why would viewership rise BECAUSE of the Will Smith slap? Did people tune in after hearing about that on social media or something? It's not like the slap was advertised in advance… that's a strange attempt at cause-and-effect analysis.
“Still, there is no question that TV viewing habits have changed. Before 2018, the Oscars telecast had never dropped below 32 million viewers.”
Ooh, that's good context. To recap, the 2024 numbers were 19.5 million. That's a huge DECREASE from 2018. Doing the math, it's a 41% decrease since 2017 (32.9 million viewers).
Oscars Viewership Over Time: The Long-Term Trend
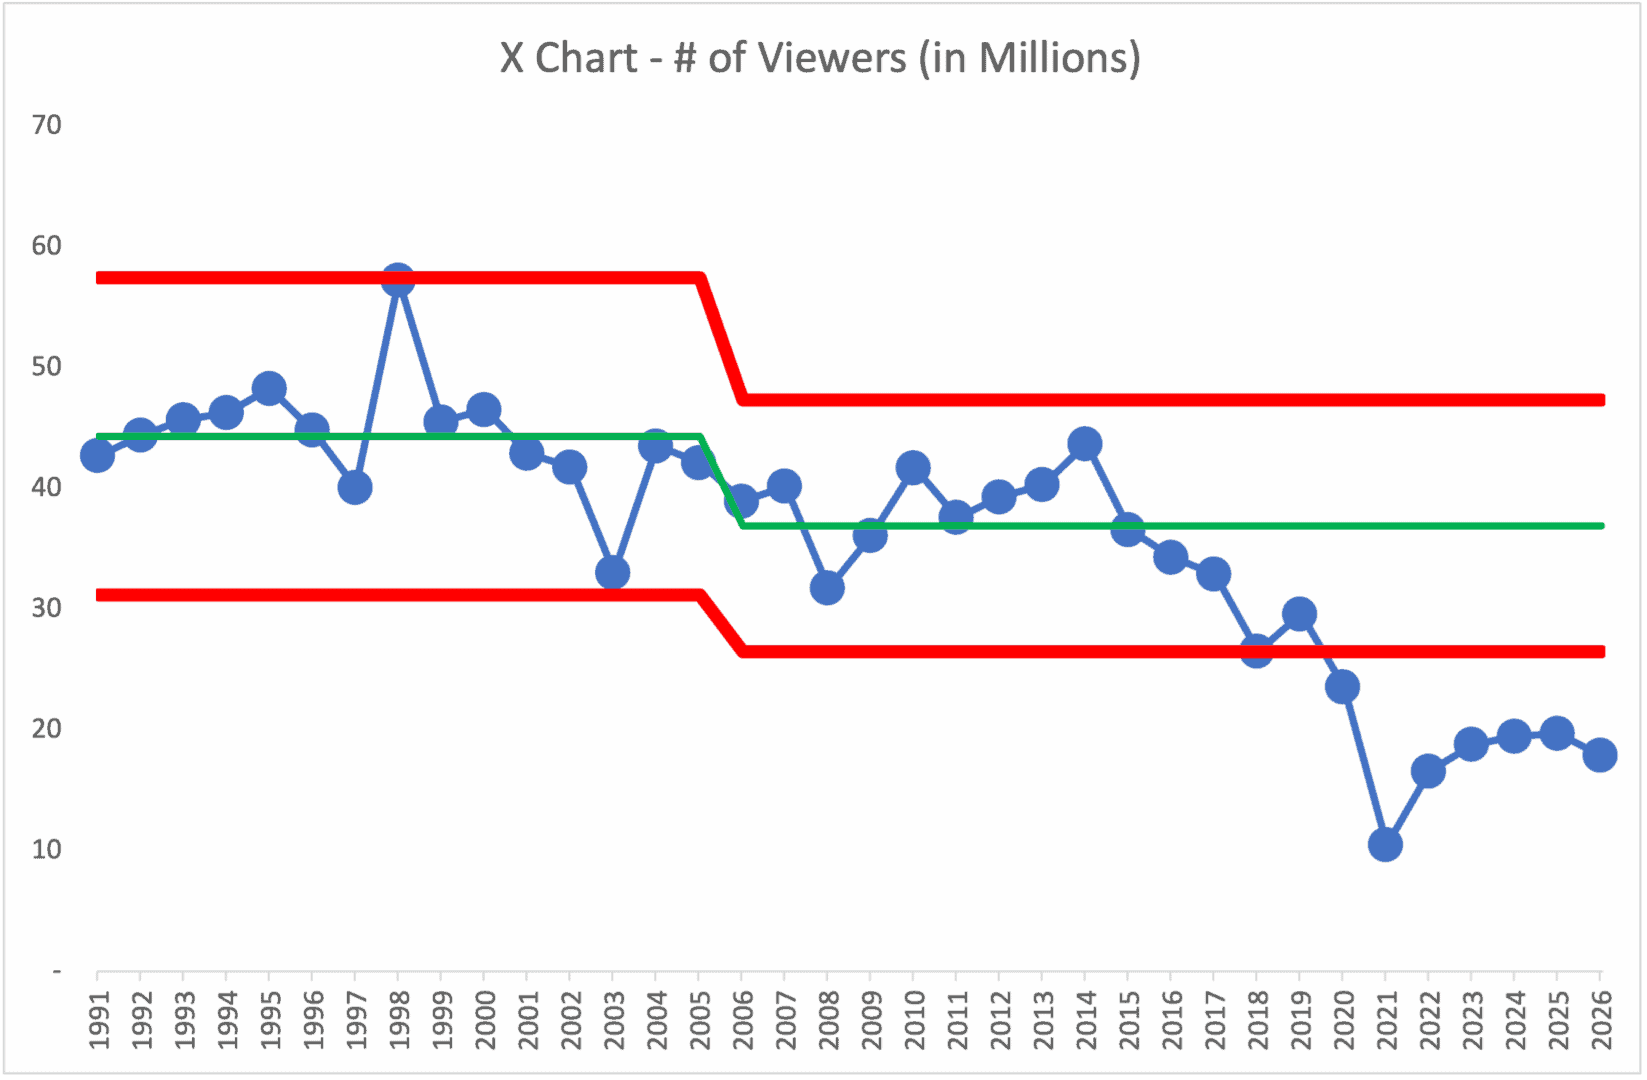
As I like to do, I've updated the Process Behavior Chart that shows the number of viewers since 1991… also updated for 2026 numbers (17.9 million viewers):

Let's ignore the Process Behavior Chart (PBC) methodology for now. We almost don't need that complexity to analyze the Oscars' ratings. Just look at the blue dots and lines — the actual viewership numbers.
Oh my goodness, that's a horrible downward trend over time. I mean, at least it stopped falling… but the long-term trend is alarming and the long-term causes are probably easier to explain.
Signal vs. Noise in TV Ratings Data
From Measures of Success, starting with this annotated PBC that goes up to 2018:
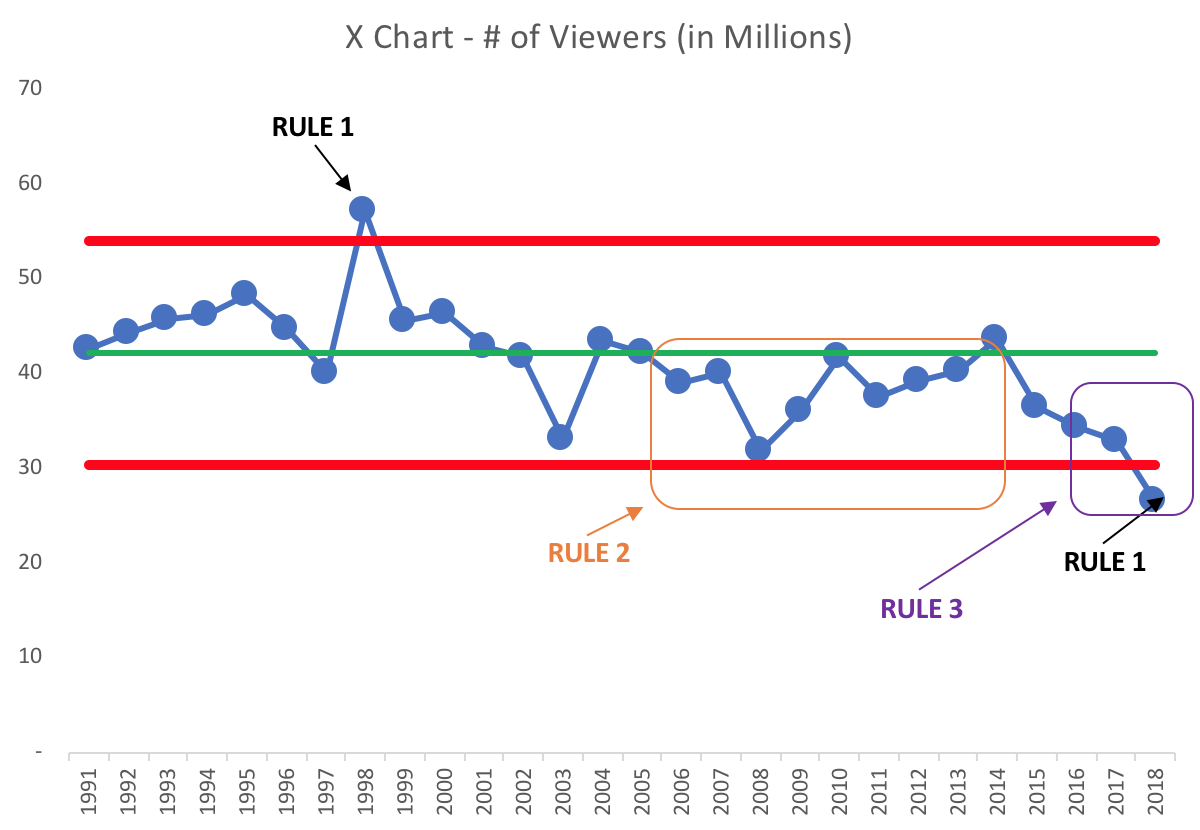
“[The chart] tells us the number of viewers is not a predictable system over this entire time frame, including 2018. We cannot predict future viewership numbers, since this chart doesn't reflect a single system over time. The system has changed.
We see multiple signals in the X Chart. There is also one Rule 1 signal in the MR chart, not shown, that corresponds with the first X Chart signal.
The year 1998 is above the Upper Limit (Rule 1). This suggests there is a “special cause” that made the system behave differently that year, even though the results were not sustained. The special cause for the unusually high viewership is commonly thought to be the popularity of the movie Titanic, which had 14 nominations that year. The MR Chart has a similar signal at the same time.
There are also eight consecutive data points below the baseline average, a Rule 2 signal. We also see a cluster of three consecutive points that are closer to the Lower Limit than they are to the average (Rule 3).
The year 2018 again falls below the calculated lower limit (Rule 1). The Academy would be correct to look for an explanation or a “special cause.” Asking about any other single below-average year would likely be a waste of time.
But the Academy missed an opportunity to start asking “What has changed?” in 2013, when the eighth consecutive year of below-average data was recorded. What led to a downward shift in viewer numbers?
If the number of viewers fluctuated around an average, it's unlikely to have eight consecutive points above or below the average. The eighth data point (not the sixth or the seventh) is a signal that something has changed, although it's possible the system changed at the time of the first below-average data point (in 2006).
What is the cause of such a shift? A 2012 Hollywood Reporter article points to the now-disgraced Harvey Weinstein pushing smaller-budget “indie” films for awards when those films were far less popular (think the opposite effect of the movie Titanic). It seems to suggest that one possible countermeasure for the Academy would be to nominate the year's most popular films, but artistic integrity would, hopefully, prevent them from doing so.
The article blamed “the exploding cable TV universe” for the decline in ratings. A systemic change like that could explain the signal of eight consecutive points below the average — and the longer-term trend. The number of TV channels seems to be increasing. That trend isn't going away.
Other supposed explanations for ups and downs in the chart include:
- Moving the telecast from Monday to Sunday
- Viewers are getting used to it being on Sunday
- The hit show Survivor was on at the same time
- 9/11
- Other world events
- New producers
- Different hosts
As a reader of this book, you realize that every metric is going to have variation. You'd know not to try to explain every up and down. With viewership numbers fluctuating around the average, the Academy could end up in a cycle in which they name a new celebrity host and see ratings go up. So, they'd bring the host back again and see ratings decline. The Academy might conclude that the public has tired of the host, leading them to hire somebody else.
Dr. Deming might have used the term “tampering” to describe that scramble for possible solutions. He'd say that tampering with a predictable system would generally increase variation in the system and the metric. Instead of making thoughtful changes based on knowledge of the system, the Academy might be trying random changes that just lead to more random fluctuation, which then causes them to draw the wrong conclusions about what works and what doesn't.
Getting back to the PBC, I redrew the Process Behavior Chart below to show where a shift seemed to occur in 2006. If we are discovering an emergent shift in the process, we might essentially be guessing when the new process began. An educated guess for when a shift below the old system's average began is the first data point below the old average.
The new average for the new system, with a baseline of 2006 to 2018, is 36.9 million viewers, with Lower and Upper Limits of 26.5 and 47.3, as shown below:
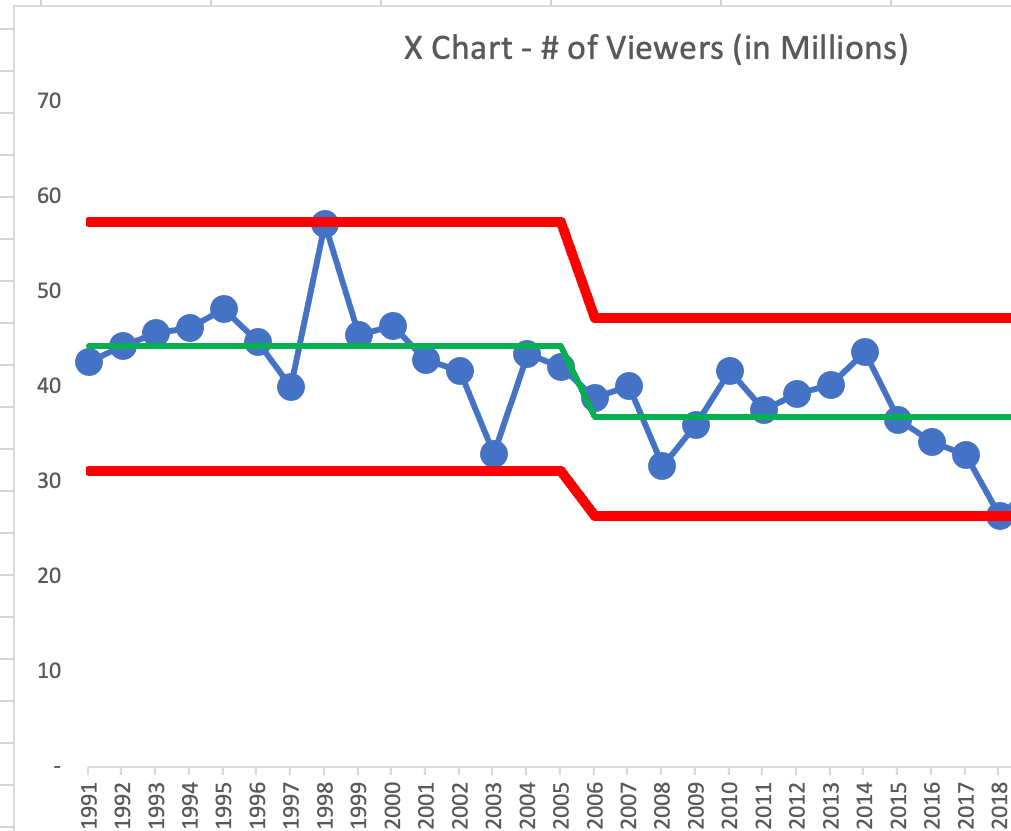
The number of viewers fluctuated around an average of 42.27 million. The old system was predictable in that the number of viewers was expected to fall within the range of 30.5-54.07 million. We would have expected that system to remain predictable until something changed in the system — whether that's a one-time event (Titanic) or a technology shift (hundreds of TV channels).
The year 2018 appears to be right on the cusp of being a special cause (Rule 1). It's right on the Lower Limit line. The calculated Lower Limit is 26.50 and, with rounding, the number of viewers was reported as 26.5. Instead of worrying about whether it's precisely above or below the limit, we can treat it as a special cause, accepting the small risk that the data point is noise instead of a signal. It would most likely be appropriate for the Academy to ask, “Why were ratings low in 2018?”
Again, the Academy missed a chance to ask something like “What changed in 2006 or so that caused the average viewership to drop to an average of 36.9 million viewers?” They could have detected this shift in 2013, when they would have seen the eighth consecutive point below the old average.
What is the special cause of that sustained shift downward? If the Academy could have identified what changed, it's possible they could have taken countermeasures to address it. On the other hand, if the special cause was a broader societal or technological trend, they probably couldn't take action. We'll never go back to a day when only seven or eight channels were available.
Since 2018 was the fourth consecutive year below the newest average, it's possible this is the beginning of another shift (some say it's due to the rise of Netflix this time). But the four data points alone are not a signal.
If we have four more years below 37.4 million viewers, or if the number falls below 26.5 in 2019 (or any other future year), we'd see a signal worth investigating.
And that signal did appear in 2020… I can't imagine a future where ratings for The Oscars increase in a statistically meaningful way.
What Changed in 2025? Why a Small Increase Still Doesn't Matter
As the updated chart earlier in this post shows, viewership was up slightly from 19.5 million to 19.7 million.
5 Reasons the 2025 Oscars Saw a Slight Ratings Increase Over 2024 ‘Barbenheimer' Showdown
It seems silly to come up with “5 reasons” for such a slight change in the metric. They're making the mistake of explaining noise. They could have cited the weather or some other random factor.
2026 Update: From a “Four-Year High” to a “Four-Year Low”
The 2026 Academy Awards, hosted for the second consecutive year by Conan O'Brien, drew 17.9 million viewers — down 9% from last year's 19.7 million. Variety reported it was the lowest-watched Oscars since 2022.
Does Conan get both the credit for the 2025 increase and… blame foer the 2026 decline?
The headlines this year are almost a parody of last year's. In 2025, the narrative was “Oscars hit a four-year high!” In 2026, it's “Oscars hit a four-year low!” Both statements are technically true. Neither one tells you anything useful about what's actually happening.
This is exactly the kind of year-to-year comparison that Process Behavior Charts are designed to cut through. Going from 19.7 million to 17.9 million is a drop of 1.8 million viewers. Is that a signal — evidence that something changed in the system? Or is it noise — normal fluctuation within a system that's been bouncing around the high teens for several years now?
Update the PBC chart with the 2026 data point (17.9 million) and it will almost certainly fall within the current limits. That means: noise. Not a crisis. Not a trend. Just the system doing what the system does.
The Guardian's headline — “Oscars ratings in US dip to four-year low, defying expectations” — is a perfect example of the problem. Expectations based on what? A single year's uptick? The system hasn't meaningfully changed. The data point moved within its expected range. Nobody's expectations should have been “defied” by this.
If anything, the 2025-2026 whiplash proves the point this post has been making since 2018: stop explaining individual years. The Oscars aren't recovering. They aren't collapsing further. They've settled into a new reality of roughly 17-20 million viewers, and until something structurally changes in how people consume live television, that's where they'll stay. Any given year might be a little higher or a little lower. That's not news. That's variation.
The real question remains the same one it's been for a decade: what would it take for the Academy to accept that the system has fundamentally shifted, stop chasing the nostalgia of 40-million-viewer nights, and figure out what success looks like in the streaming era?
What the Oscars Teach Us About Metrics, Media, and Management
The Academy Awards might be up year-over-year in viewership, but headlines celebrating a “four-year high” miss the bigger picture–especially when the broader trend tells a different story.
We can't make good decisions from noise. And we certainly shouldn't celebrate random fluctuations as if they're meaningful improvements. As viewers, executives, or data-minded professionals, we should be wary of drawing conclusions from small sample sizes or cherry-picked comparisons.
What's far more helpful than spinning narratives around this year's tiny bump is recognizing when a system has fundamentally changed–and asking the right questions early enough to respond.
The lesson here extends far beyond Hollywood.
Whether you're running a factory, a hospital, or a global awards show, the real work is understanding the system behind the numbers — not reacting emotionally to every uptick or downturn.
How to Learn More
If you want to better understand how to separate signal from noise in your own organization, check out my book Measures of Success–and explore how you can apply Process Behavior Charts in your daily management systems.
And if you're interested in learning these lessons in a hands-on, practical way, join me at an upcoming workshop or learning experience. We'll do more than just admire charts — we'll learn how to run our systems better.
Frequently Asked Questions
Year-over-year, sometimes. The 2025 ceremony drew slightly more viewers than 2024, and the headlines called it a “four-year high.” Then the 2026 ceremony dropped 9%, and the headlines called it a “four-year low.” Both statements were technically correct. Neither one reflects a meaningful change. Oscars viewership peaked at over 55 million in the late 1990s and has settled into a range of roughly 17-20 million. Small movements within that range are noise, not trends.
The decline correlates with systemic changes in how people watch television — the rise of hundreds of cable channels, then streaming platforms, then social media. These are structural shifts in the media landscape, not reactions to specific hosts, nominated films, or ceremony formats. Process Behavior Charts show the decline as a series of downward shifts in the system, not random yearly fluctuations.
A Process Behavior Chart (also called a control chart) is a tool for distinguishing meaningful change (signal) from normal variation (noise) in data over time. Instead of comparing two data points and declaring a trend, a PBC uses statistical limits to show when a metric has genuinely shifted. For Oscars ratings, PBCs reveal that most year-to-year changes are noise — the real signals are the systemic downward shifts that occurred around 2003 and again around 2018. For more on how to use PBCs in your own work, see my book Measures of Success.


[…] based on the large point-to-point variation in the data over time. Unlike other TV ratings (like The Oscars), there doesn’t appear to be a definitive downward trend over […]
I cant believe one of your main reasons was not the large left swing of actors and Hollywood overall over the last 15 years or so. If you swing so far one way or the other (left or right) you will lose views from about 1/2 of the population. We want to see actors act and musicians play music, not hear a 10 minute speech about why their world view is right.
Hollywood has been considered “liberal” for many decades or as long as I can remember. That was a frequent topic of Rush Limbaugh’s in the 1990s.
This article says Hollywood became “liberal” in the 1970s.
2025 ratings were, at first, said to be down a bit… but now that streaming stats are involved, ratings are up about 1% over 2024. So, it’s meaningless to even discuss “why?”
LINK