

When It’s Easier to Distort the System Than it is to Improve It: Baseball Attendance
I'm often reminded of what the late Peter Scholtes would write or say (often repeated by W. Edwards Deming), where he basically said there are three things that can happen when there's pressure to meet a goal or target:
- Distort the numbers
- Distort the system
- Improve the system
Edit: The primary attribution for what Scholtes and Deming shared should go to Brian Joiner.
#1 and #2 are often described as “gaming the system” or “fudging the numbers” as I've written about before in context of Scholtes.
Deming railed against goals like “zero defects” (and would probably say the same about a “zero harm” goal) but I think what he and Sholtes warned about was setting a target and doing nothing, as a leader, other than demanding “results or else.”
When we have a goal, Dr. Deming would ask, “By what method?”
Having a method matters. Having the right leadership (as the late Paul O'Neill provided in the name of zero harm) makes all the difference and gives people a fighting chance.
I remember a Dr. Deming story about a factory that had a target for reducing injuries, maybe it was zero, but there were definitely financial incentives dangled in front of people. Well, the answer was easy — people stopped reporting injuries, even when people were quite obviously harmed.
Back to the Scholtes framework, when it's easier for people to distort the numbers or to distort the system, they'll do that. And that's not their fault. When leaders don't help people actually improve the system (or don't let them), that's a management failure.
The Major League Baseball Attendance Fudging
This story isn't about recent events, but I heard about it during an episode of the Dan Le Batard Show podcast. His guest was David Samson, who was the president of the Miami Marlins MLB team from 2002 to 2017.
The story he told got a write up here:
Former MLB executive says commissioner Bud Selig worked with teams to rig attendance figures after the steroid scandal
Then-commissioner Bud Selig wanted to see growth in attendance. He wanted MLB to set records each season. That's his prerogative as a leader and you could argue it was his responsibility to grow the sport for obvious financial reasons (and for his own job performance and/or ego).
Did he help MLB teams improve the system? Or did he help them distort the system?
Samson said Selig was distorting, “rigging” — you could say fudging or cheating.
“…former MLB Commissioner Allan “Bud” Selig had teams give away hundreds of thousands of free tickets to fans. Those tickets were then used to boost overall industry attendance and make baseball look healthier than it was.
“He wanted the narrative every year that baseball attendance was increasing,” Samson said. “When it came out that attendance was actually not going up, he invented something called ‘discretionary tickets.'”
Butts in seats is not the same as paid attendance, from a financial perspective. But, if you get people to the game, they'll spend money on parking, food, and merchandise in a way that's profitable… if you actually get them there.
“The teams and MLB then counted those “discretionary tickets” toward their total paid attendance figures even if the tickets were never used.”
It's time for Coffee Talk… those tickets were neither “paid” nor “attendance” — discuss amongst yourselves.
It “worked for a while,” but the practice has now supposedly stopped.
As Insider reports, this distortion was an open secret for a while.
In 2005, the Los Angeles Times announced it would stop including MLB attendance figures in their stories because of the discrepancies between attendance figures that teams were reporting and actual attendance at the games.
“In effect, we're intentionally presenting inaccurate information while attributing it to the home team,” former Los Angeles Times Sports Editor Bill Dwyre wrote in a memo.
They didn't want to be publishing “fake news” that was provided by the teams or MLB.
So, after that period of distortion, you'd see bad results when the practice stopped. Leave the problem for the next executive?
If you know me, you'd expect me to “plot the dots” to look at these numbers over time. I'll do a simple run chart of “attendance per game” (to adjust increases in the number of teams or the reduction in games last year with the pandemic or the reduced capacities in 2021 as ballparks reopen):
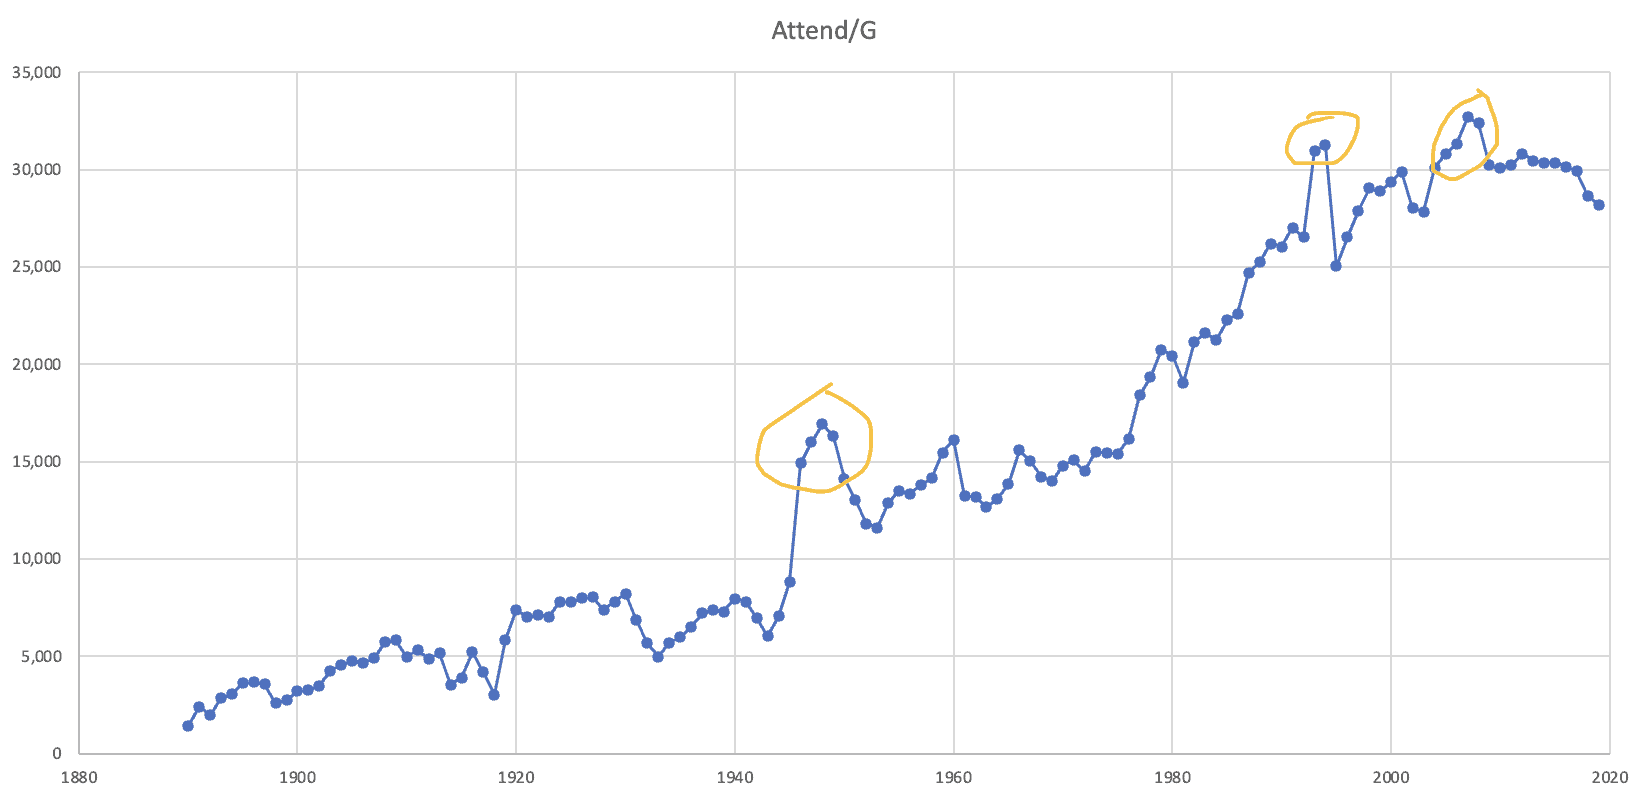
There's a clear upward trend over time. You see some blips that go outside of the usual linear growth rate (circled by me in yellow).
- Post WWII years
- 1993 and 1994 (before the strike that led to the cancelation of the '94 World Series)
- 2004 to 2008 (when MLB might have been juicing the numbers)
Selig and MLB may have conspired to make things look good in the short-term… but it was a house of cards.
When you fudge the numbers or distort the system, you might get away with it for a while… but it almost always comes back to bite you.
Actually improving the system is the only effective long-term strategy.


Mark,
Interested in your thoughts. Do you think that control charts or process behavior charts would give you some ability to detect distorting the numbers rather than improving the system? In a way you’ve shown it here with this example: if you put tolerance bands on the trend line and detect those outliners that you show manually.
Yet another reason to use them.
Great question, Andrew. Seeing a “signal” in a Process Behavior Chart (a form of “control chart”) tells us that system has changed.
The chart doesn’t tell us *what* changed. The outlier (or the shift in performance) could be caused by a distortion to the system, or it could be legit honest improvement of the system.
Thinking of the famed Wells Fargo case (the CEO saying “eight is great” and wanting customers to have eight accounts), I bet if we had a PBC for “average accounts per customer,” we would see a shift upward… caused by bank employees opening up unauthorized accounts.
Yeah, the system changed… but not in a good way.