


Today's post is some material that I wrote for my book Measures of Success but cut due to length. I've modified the material a bit to hopefully be fine as a standalone post.
There's a somewhat humorous, if not scary, story from a book (This is Going to Hurt) written by a former “junior doctor” in the British National Health Services (NHS) — the equivalent of a “resident” in the American medical education system.
One day, he noticed that “every patient on the ward has a pulse of 60 recorded in their observation chart.” That seemed like an unusually small amount of variation in that ward's system.
Let's say there was a “Process Behavior Chart” (PBC) done for a single patient's pulse, taken hourly over the days of their stay. The doctor might have seen an X Chart that looked like this:
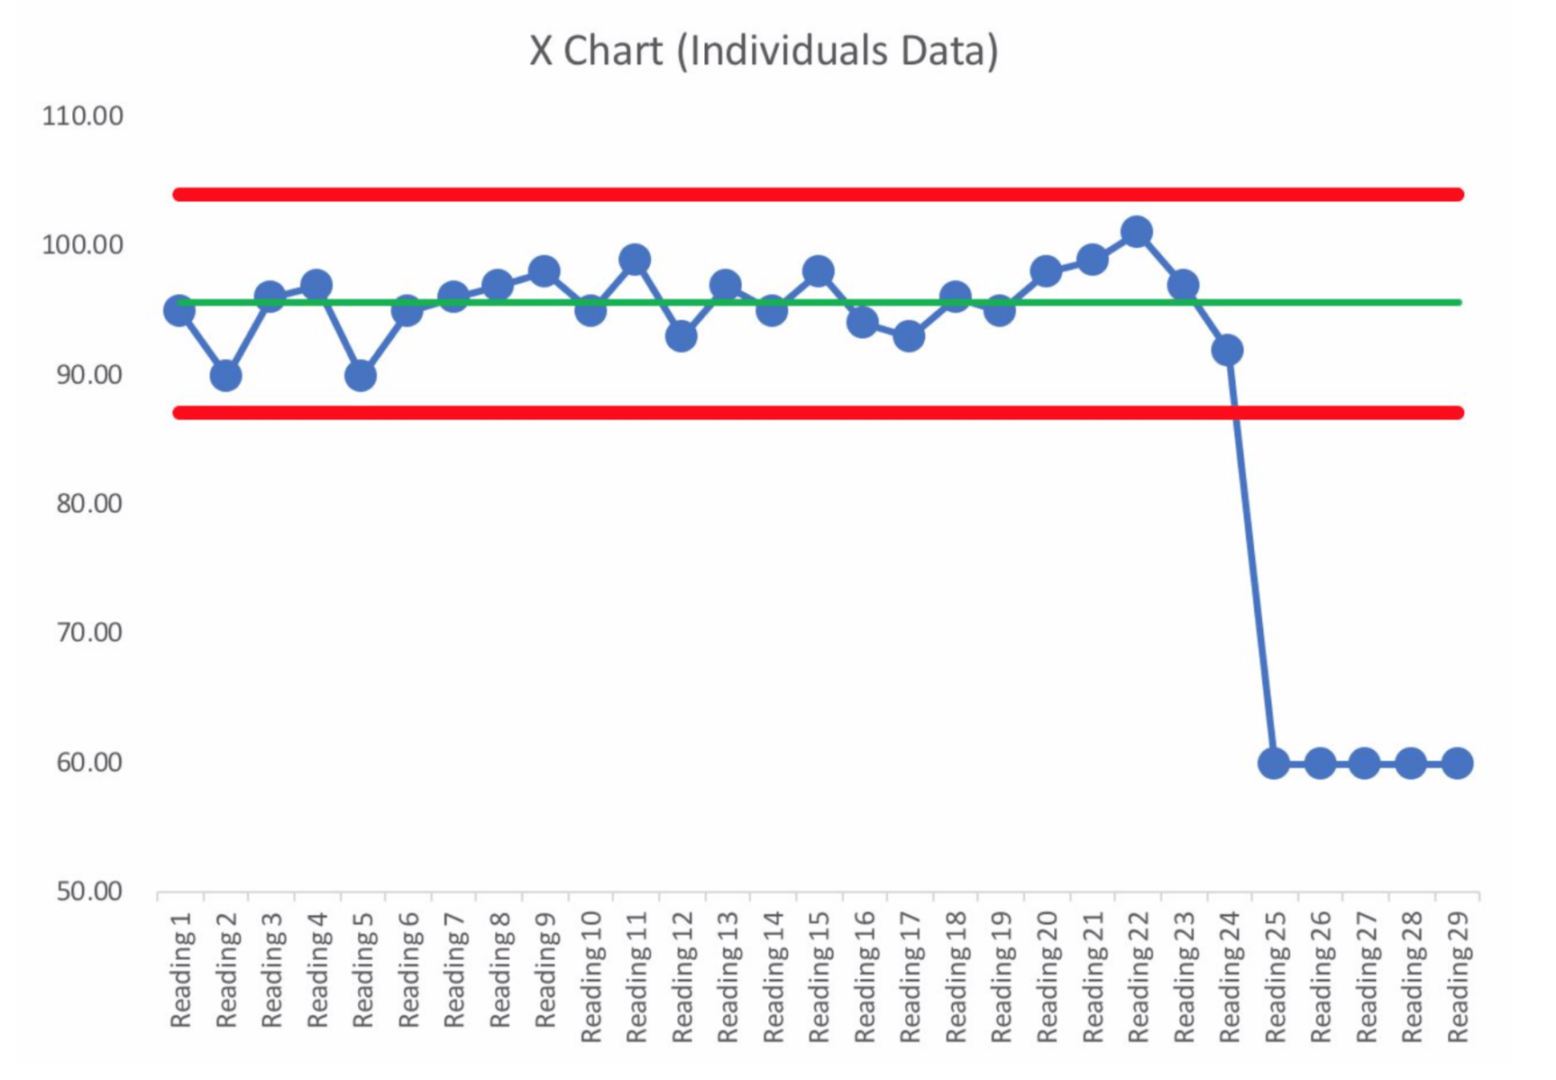
The red lines are the calculated “Lower and Upper Natural Process Limits” that tell us the range of routine variation in what had been a “predictable system” up until the pulse readings of 60. If the system hadn't changed, we would have expected any future pulse rates to fall between about 86 and 104. We could use our three rules for evaluating a PBC to look for signals of a change:
- Rule 1: Any data point outside of the limits.
- Rule 2: Eight consecutive points on the same side of the central line.
- Rule 3: Three out of four consecutive data points that are closer to the same limit than they are to the central line.
The baseline of the patient's first 24 hours in the hospital could establish a baseline average pulse, along with the Lower and Upper Limits. The first data point of 60 is, of course, a Rule 1 signal. Along with a pulse reading of zero, this single data of 60 would indeed be worth reacting to and investigating (if my pulse were zero, I'd want countermeasures taken to revive me instead of waiting for “root cause analysis” to be completed).
Even without a PBC, Dr. Kay thought to investigate. Asking why an individual's pulse was suddenly lower might point to questions about medications or that patient's condition. But, seeing that every patient had a pulse of 60 pointed to a different, more systemic cause.
Instead of asking why multiple times, Dr. Kay went to observe a healthcare assistant who had started a shift and was recording the 60 pulse numbers. As Dr. Kay wrote, he “surreptitiously inspect[ed] the healthcare assistant's measurement technique. He feels the patient's pulse, looks at his watch and meticulously counts the number of seconds per minute.”
That's undoubtedly a special cause! That's not how you take a pulse, of course. Teaching the healthcare assistant the proper method for taking a pulse would probably address the situation, restoring the system and the pulse metric back to its normal state.
But, blaming or labeling someone as a “bad healthcare assistant” might not get to the root cause of the problem. Firing that “bad healthcare assistant” might only mean that you eventually get another “bad healthcare assistant” in their place.
Why was the pulse number wrong?
- The healthcare assistant was counting the number of seconds (60) in a minute on their watch.
Why was the healthcare assistant counting the pulse that way?
- They were never trained on the proper way to take a pulse.
Now, that might not be the only answer to the second why. We could also answer it by saying things like “the healthcare assistant was not being supervised” or “the system hired an unqualified person.” There might be multiple answers to each “why?” so we might end up with something that looks like a tree diagram instead of a linear flow.
For each answer or cause, we might ask if there is evidence that supports the statement or if it's a guess. In problem solving, verifiable facts are more helpful than assumptions. The only way to really validate that we've identified a cause is to develop and test a countermeasure that we think will address the cause, looking to see if we've affected our results by preventing future signals or shifting our performance over time.
One short-term countermeasure here might be some immediate training for that particular healthcare assistant. We might also find out if any other assistants are doing the same thing. Longer term, we might improve the hiring and training processes to prevent this and other problems from occurring.
As with Process Behavior Charts, the point is not to be technically correct with a root cause analysis — the point is solving the problem and improving our performance in a sustainable way.
At some point, we might suspect we have identified the root cause of a signal. When we are talking about or brainstorming possible root causes, that's initially only a hypothesis about a root cause. We don't yet know that we have found the root cause if we're just talking.
I've been taught by former Toyota leaders that you have to test your hypothesis about the root cause. If you implement a countermeasure that's meant to address the root cause, you need to look to see if performance improves. If we react to a negative Rule 1 signal of a single point outside our Natural Process Limit, we'd look to see if our countermeasure puts the metric back into its prior range. If not, we probably haven't found the root cause (or we didn't find an effective countermeasure) so we adjust and “spin the PDSA cycle” again, as they say in many Japanese organizations.
If your countermeasure puts the process back into its normal, predictable range, you can turn off the countermeasure to see if the poor performance returns. It might not be ethical to do so in some situations if we are trying to solve a patient safety problem.
To learn more about my book Measures of Success and how these analysis methods can help your organization, check out my book's website.
Please scroll down (or click) to post a comment. Connect with me on LinkedIn.
Let’s work together to build a culture of continuous improvement and psychological safety. If you're a leader looking to create lasting change—not just projects—I help organizations:
- Engage people at all levels in sustainable improvement
- Shift from fear of mistakes to learning from them
- Apply Lean thinking in practical, people-centered ways
Interested in coaching or a keynote talk? Let’s start a conversation.


