

Stop Overreacting to Metrics: Lessons from Lean Startup Week
tl;dr Leaders waste enormous time overreacting to normal ups and downs in metrics. Process Behavior Charts help separate noise from real signals, so teams stop chasing explanations, reduce fire drills, and focus on improving the system instead of reacting to every data point.
Thanks to Eric Ries and the organizers of Lean Startup Week for allowing me to share the video of my 15-minute talk from last year's event.
One reason for sharing this today is to celebrate yesterday's initial release of the in-progress version of my book Measures of Success. If you buy the book now, you'll get a PDF, as well as MOBI (Kindle) and EPUB formats, of the first three chapters, or about 40% of the book's expected content.
EDIT: The book is now completed and available in a few different channels. Click here to learn more.
The book includes examples from settings outside of healthcare, as my Lean Startup Week talk focused on examples from software startups.
Here is the video, with a transcript below, augmented with some of the slides.
Transcript:
[applause]
Mark Graban: Hi. When I read Eric's first book The Lean Startup, he asked a very important question in the very last chapter of the book. He asked:
“If we stopped wasting people's time, what would they do with it?”
I think this is really important question even in a background in healthcare. If we stop wasting the time of nurses so that they're not running around all day looking for IV poles and pumps, they get to use that time to be at the bedside with patients providing better patient care. That's good for everybody involved.
We can also think as leaders, “What can we do to stop wasting our time and stop wasting the time of the people who work for us?” In the Lean Startup movement, of course we talk a lot about choosing the right metrics, not wasting time talking about vanity metrics and trying sell somebody or paint a picture that tells the story we want to tell but instead looking at metrics that really matter.
What can we do to stop wasting our time and stop wasting the time of the people who work for us? Share on XIn Eric's new book, he points out the fact that your site has seen an uptick in visitors doesn't mean your product is more popular or that you're more successful. We want to move away from vanity metrics.
Once we've chosen the right metrics, I think there's another really important question of what do we do with the right metrics? How do we look at these meaningful metrics? How do we not overreact? How do we not waste time in the process of trying to manage these metrics and drive improvement?
Let me modify the point from Eric's book a little bit and add the fact that your site has seen an uptick in visitors doesn't mean your site is getting more visitors. You might think, “Well, wait a minute, what do you mean?” Here's what an uptick might look like.

This is data from my blog. March to April 2017, I'd say, “Hooray, look at that uptick! We're moving up and to the right.” I might like to pretend that trend is going to continue forever. Now with the blog, I'm not trying to convince investors or anybody about progress. I'm not trying to engage in success theater. I might be fooling myself.
We do better by looking at the broader context of our data with a run chart. Would I draw that same conclusion by looking at better context? What is the voice of the process telling us instead of trying to fit the data to the story we want to tell? When we move from vanity metrics to what Eric calls “actionable metrics,” it's really important that we don't turn these into overreaction metrics.
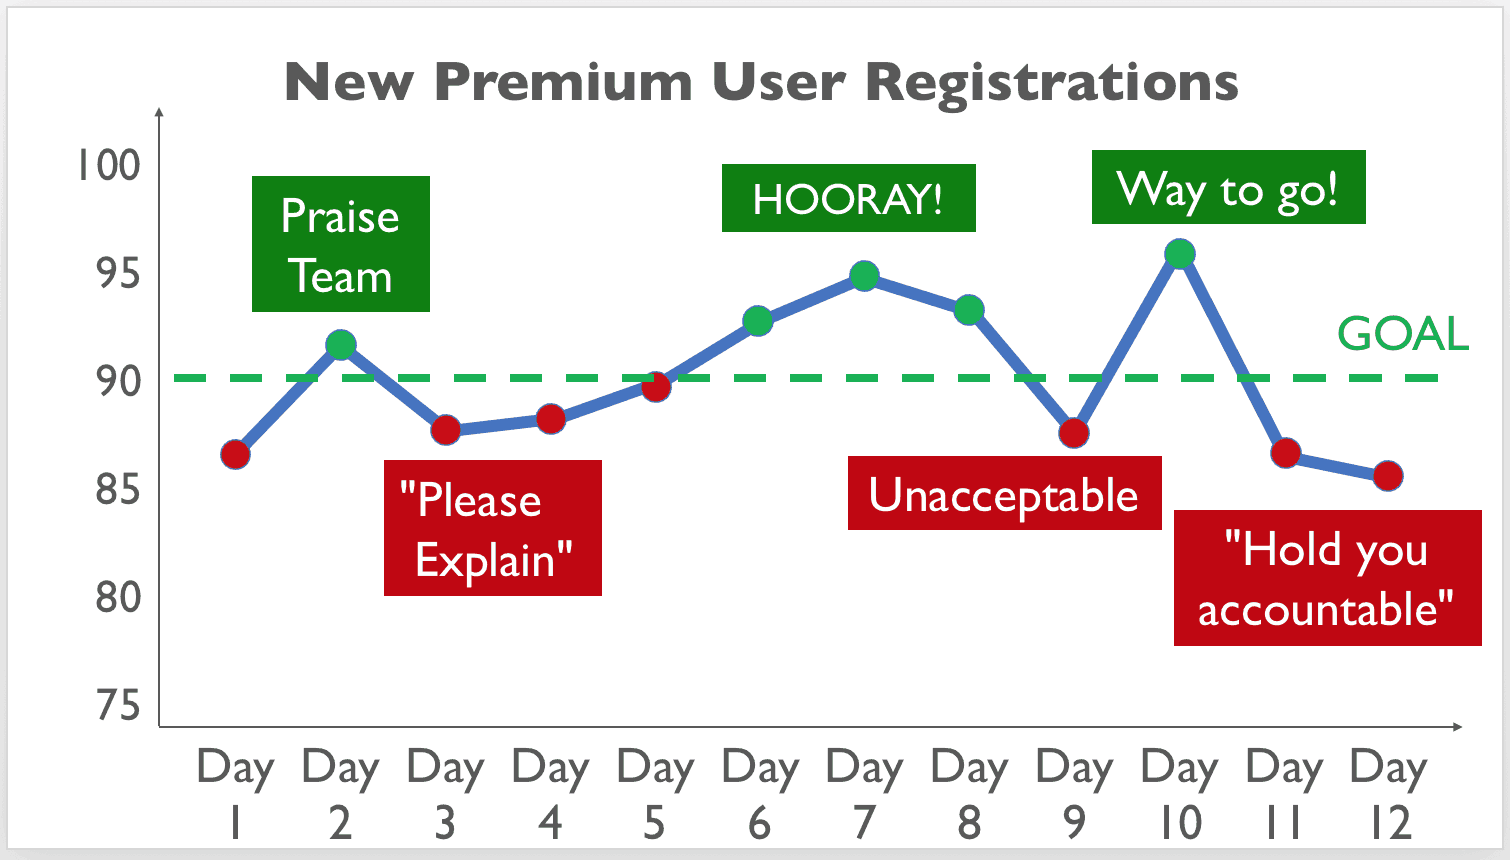
When we move from vanity metrics to what Eric calls 'actionable metrics,' it's really important that we don't turn these into overreaction metrics. Share on XLet me share an example that's very typical of different organizations I've seen. We might have a metric, new premium user registrations. That might be core to our business model. We have a data point of about 86.
A well-intended leader might look and say, “Well, we need to set a goal. I want better performance, more success. I'm going to set a goal of 90. I'm going to communicate this to the team.”
We come back the next day. We see, good, we have an uptick. Performance is better. We're above the goal. We color that green. We praise the team. We maybe pat ourselves on the back too as leaders because good for us setting that goal. We motivated people.
We come back the next day. We see performance has dropped. Know what happens in a lot of situations like this is you might get an email that goes out with a real terse, “Please explain.” Email like this takes maybe 30 seconds to send out. The response to that email might consume hours and hours of people's time, discussions, meetings, research, looking for an answer that might not really be there.
By the time they've gone through that, we see performance has inevitably improved. It's gone up. We're above the goal. We celebrate. Then performance drops. We tell them team, “Well, this is unacceptable.” We maybe start to think, “Well, every time I praise the team, they start slacking off. I'm going to quit praising them.”
Performance gets better. We say, “Way to go.” Then things drop. We start throwing around phrases like, “We're going to hold you accountable.”
When we step back and look at this data in context, we see maybe it's just fluctuating around an average. The same system, the same people doing the same work are going to generate different results in different time periods. As hard as that might be to accept, it's true.
A lesson we learn from a statistical approach to metrics is don't waste time explaining noise. Don't ask people to explain noise in the data because, more often than not, there is no root cause for that noise. Asking why five times or six times or twelve times won't necessarily lead to a single magical root cause that explains that performance.
A book I highly recommend, it's called Understanding Variation. This is a core book on this methodology. Don Wheeler who wrote this says:
“While every data set contains noise, some data sets might contain signals. Before we can detect a signal within any given data set which might any metric that we're following and tracking, you must first filter out the noise.”
You might think, “Well, do I guess? Is this gut feel? How do I filter signal from noise in my data?”
We have a method that Dr. Wheeler calls “Process Behavior Charts.” It's a variation on something that you might have heard of called control charts or statistical process control charts. Let me share an example of how this can be very useful.
We take that same data that we had in the previous chart with all the ups and downs and the overreactions. We have our goal. One thing we're going to do is calculate an average off of some baseline data. This average performance may or may not be near our goal. What we're looking for is to answer the question is the performance of the system stable and predictable?
We calculate two other very helpful lines called process behavior limits at an upper and a lower bound. Again, these are calculated. We don't set goals. This is not what we want the process to do. This chart tells us how the process is performing. We see with this baseline data with all of these data points basically just fluctuating within those red limits, all of these data points are noise.
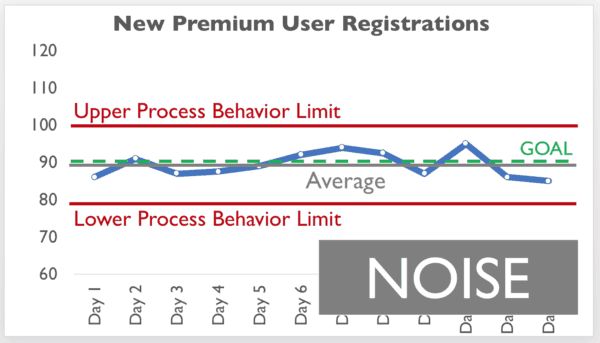
Any time spent asking, “Why did we have a bad day? Why was there a good day?” is more than likely a waste of time. It distracts people from the effort we might put into actually improving performance, better understanding our system instead of just being really reactive.
Let's take a look at how this chart might be used over time. We have our baseline data. We've established these upper and lower limits. We would predict that any future data points are likely to fall within these boundaries unless something has changed.
Let's say we come back, and we see on our next day, we've got a single data point below that calculated lower limit. This is one example of a signal, statistically meaningful difference in the data that would trigger us to ask why.
The fact that that single data point is outside of those control limits, those behavior limits, tells us that there is likely a signal that's worth investigating. There are a number of rules and heuristics that we can use to evaluate if it's just noise or if there's signal, one of those rules being above or below those lines.
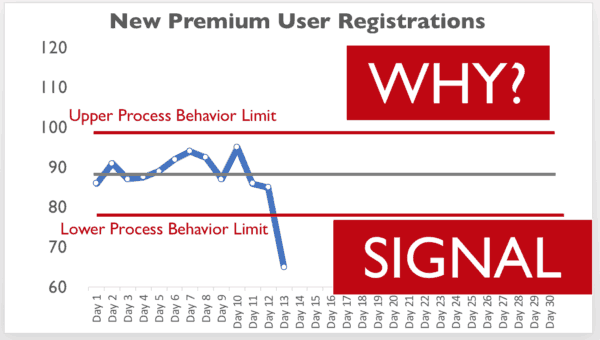
We learn there might be a root cause for a signal. We might investigate and ask why did we have fewer registrations that day? There might have been a problem with the website or with some API connections. We fix that. We eliminate the root cause or the special cause. Performance goes back to where we would have expected it to go.
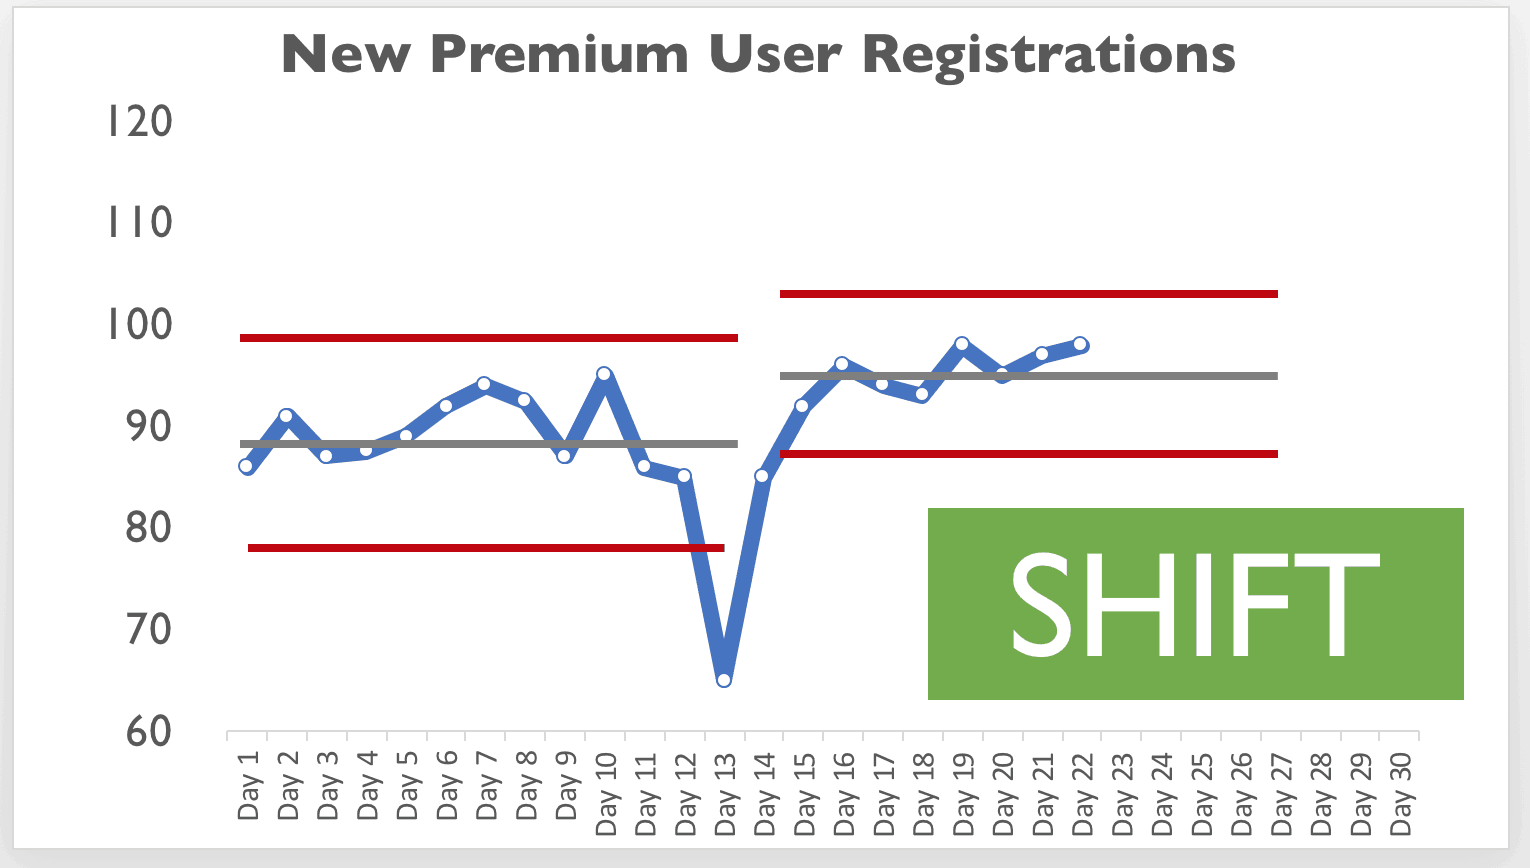
Now let's say we've made some other intervention in our system. We've made an improvement to our marketing process. Now we see performance start going like this. This is by our rules and heuristics another signal. Eight consecutive data points above or below the average again triggers us to ask why, that this is unlikely to be just randomness or noise or chance.
It's worth investigating to make sure we know why performance has improved so that we can lock in that change to the system. We might calculate new limits that help visualize a shift in that performance. We'd say, “Well, now we would predict that our average number of registrations would be more like 95 a day instead of 90 a day.”
Let me share one other example where I've coached the team at KaiNexus to use some of this methodology. Our CEO, well-intended, in meetings would often ask our director of marketing, “Why were leads down last month?” It was a non-blaming, non-judgmental, inquisitive question… why were leads down last month?
Our director of marketing, the only honest answer really was to just do this.

I don't know. Some months it's up. Some months it's down. We've learned to not overreact to that noise in the system.
If we look at our data and instead of looking at two data points, why's it higher, why's it lower, we look at a chart. We see sure enough it's fluctuating around an average. We calculate that process behavior limit. This tells us everything within those boundaries if none of our rules that indicate a signal are triggered, this is all noise.
We can ask the question, “How do we improve the average number of leads?” but that's a different train of thought than asking, “What went wrong yesterday, last week, last month?” A lesson from Don Wheeler, he uses the phrase writing fiction. Don't waste time writing fiction, cooking up and concocting plausible-sounding explanations for every up and down. We instead focus on improving the system.
With our director of marketing freed up from having to explain, she said, “I probably spend an hour looking at data and trying come up with an answer,” she focuses on improving the system. We see performance start doing this over time.
Again, we have that rule that looks for eight consecutive data points above the old average. This tells us that there's a signal. It's no longer fluctuating around that stable and predictable average.

Again, the important thing to do here is to ask why. Do we understand cause and effect relationships? Did we do something that had a hypothesis that would lead to more tier one leads? If so, this chart might actually confirm that in a statistically compelling and convincing way, better than just a before and after summary or some other form of success theater.
If there's not a hypothesis we're testing, we should ask why and make sure we understand why the number of leads started increasing. Because if we don't understand why, there's a risk that it could level off. It could go back to the level of performance we had before. When we start ignoring some of this up and down and the noise and look for signals, we can better focus our energy on improvement.
We ended up on a growth trajectory. It's better to see instead of just fluctuating around an average. You can do a form of a Process Behavior Chart that has boundaries and limits that go around that growth trajectory. We would look and ask the same question, that any single data point within those red lines is likely to be noise.
We expect it to be growing. Again, some months it's going to grow more, and some months it's going to grow less. When we start asking, “Why are we falling off track for a little variation in the number?” we can again spend more time on working toward exponential growth.
In fact, we see those two data points there that are very close to the red line. That actually triggers one of the rules and heuristics, the signals that we look for. It's statistically unlikely that we would have two data points right there near the limit. We make sure we understand why.
To wrap up, looking at Eric's first book, if we stopped wasting people's time, what would they do with it? Eric answered the question pretty well a couple paragraphs earlier in the chapter.
“We would achieve speed by bypassing the excess work that does not lead to improvement.”
I think that's exactly what happens when we're overreacting to noise. It's excess work. It's wasted motion. It does not lead to learning. It just keeps people busy. It feels like we're doing something even if it doesn't really help. If learning and if cycles of validated learning lead to improvement, the lesson that we get from this methodology is that we can improve more if we overreact less.
...the lesson that we get from this methodology is that we can improve more if we overreact less... Share on XI would invite you, come join me up here during the lunch and learn session. We're going to run as Eric mentioned this morning the Red Bead Experiment. This at least for 10 people a very hands-on exercise. We go through a bit of a silly process where we are creating beads.
The red beads represent defects in our process. I'll do some roleplaying. We'll have an opportunity maybe to build some intuition about what is noise in a performance measure, the number of defects, the number of red beads, and what is a meaningful statistical shift in the data. How do we manage a system like that? How do we improve it? That's what we're going to learn.
I hope you'll come join me. We'll have a lot of fun. I would encourage if you'd like more detail about how to calculate these limits, a little bit deeper dive into this methodology if you go to markgraban.com/lsw or /leanstartupweek. You'll find more details there.
I hope it's helpful. It's been incredibly helpful to me. That's why I wanted to share that with you today. Thanks.
[applause]
Stop Overreacting to Metrics–and Start Improving the System
When leaders stop reacting to every up-and-down in their metrics, they reclaim time for real learning and real improvement. Process Behavior Charts make it possible to see performance for what it actually is–stable noise, a true signal, or a meaningful shift–so teams can focus on changing the system instead of explaining yesterday's number.
This isn't just a statistical upgrade. It's a leadership discipline. Leaders who resist overreaction reduce fire drills, eliminate wasted analysis, and give people the space to improve work rather than defend it. Over time, that shift builds trust, better decisions, and systems that improve predictably instead of episodically.
If improvement is the goal, reacting less is often the fastest way to get there.


[…] The full transcript is available at Mark Graban: Distinguishing From Noise […]