


This is a repost of a blog post I wrote a few years back… and I'm reminded of it at the start of each year.
In my travels, it's more common to see daily, weekly, or monthly performance measures posted on boards in hospital departments.
I like it best when I see time-series data displayed as a line chart (run chart) or, better yet, a “process behavior chart” (a form of what's also called a Statistical Process Control or Control Chart).
When we get to December, it's not uncommon to see 10 or 11 data points on some monthly metrics chart. That's helpful context, even if the chart is drawn as a column chart instead of a line chart. We want to see trends. We should look for outliers in the data. More data points make it easier to do this.
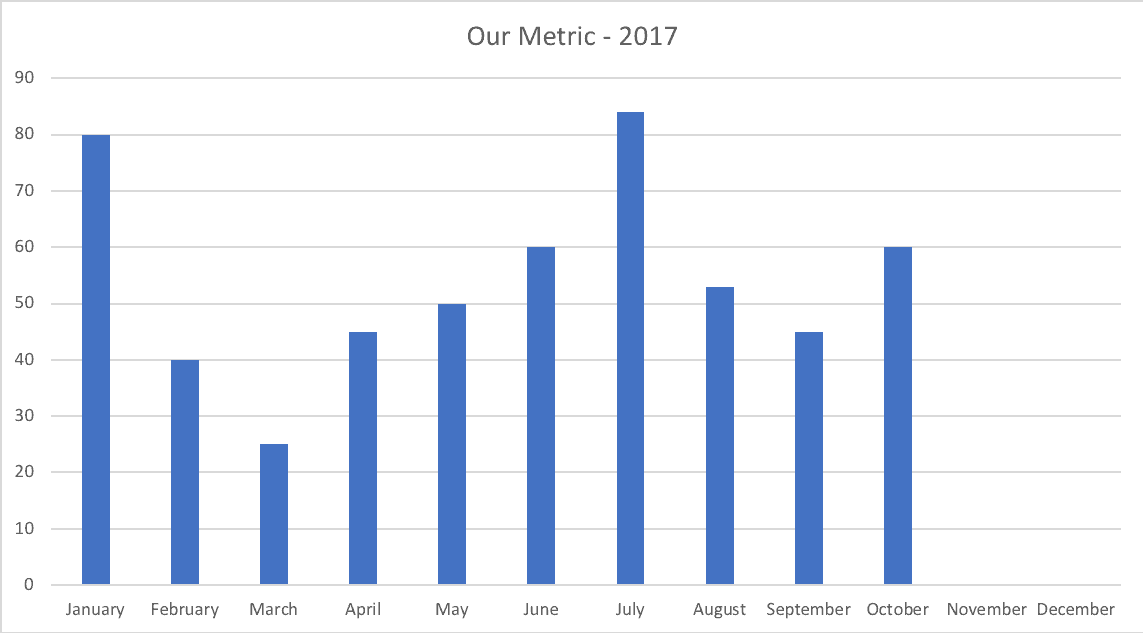
Charts like this always make me wonder why we throw away the additional context of data from 2016 when we start the 2017 chart.
It's unlikely that January 1st in any given year is the magical creation of a new system or process. In other words, January 2017 was likely the same process as in December 2016. The annual cutoffs are arbitrary. Sure, people are accustomed to thinking in annual cycles, but is this helpful for improvement?
The problem is when February 2018 comes, the 2017 data gets thrown away. We'd have a chart with one data point (January). We can, at best, compare that data point against the target (which might have changed for 2018 even though we have the same system as 2017… and we should expect the same performance without changes being made to the system).
Comparing individual data points against a (usually) arbitrary target is not the best way to manage improvement, as I've written about before.
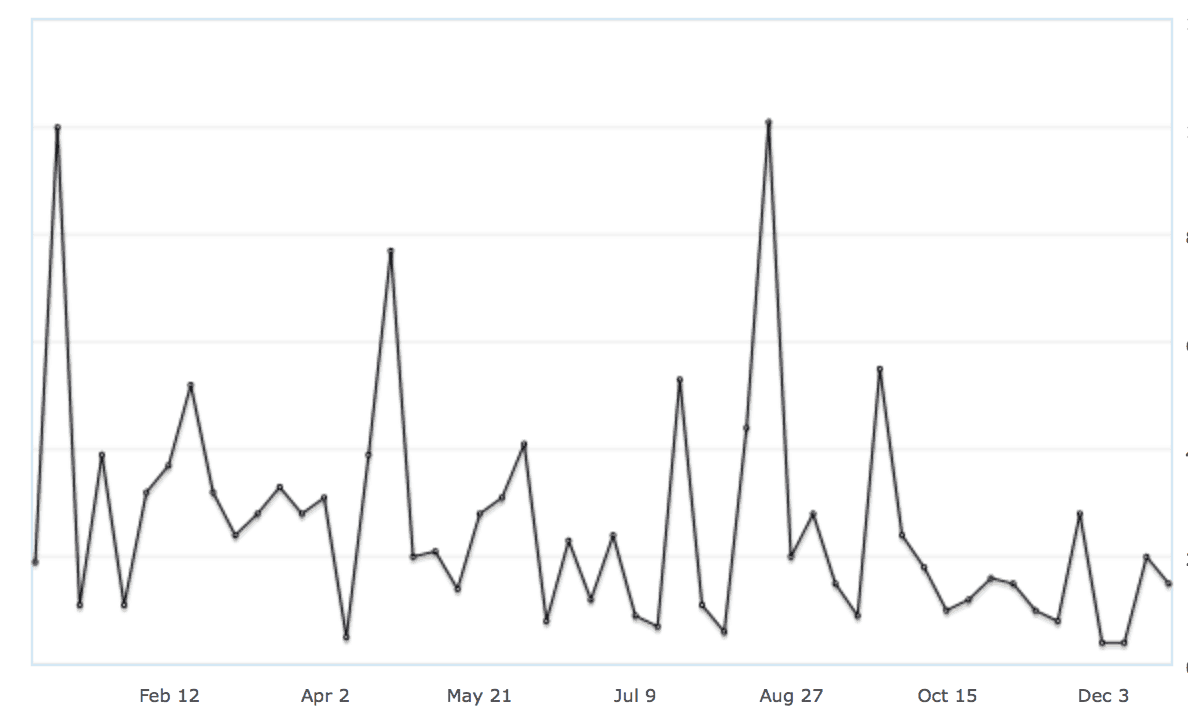
Here is a chart that Amazon shows me, with weekly book sales from 2017 as a line chart:
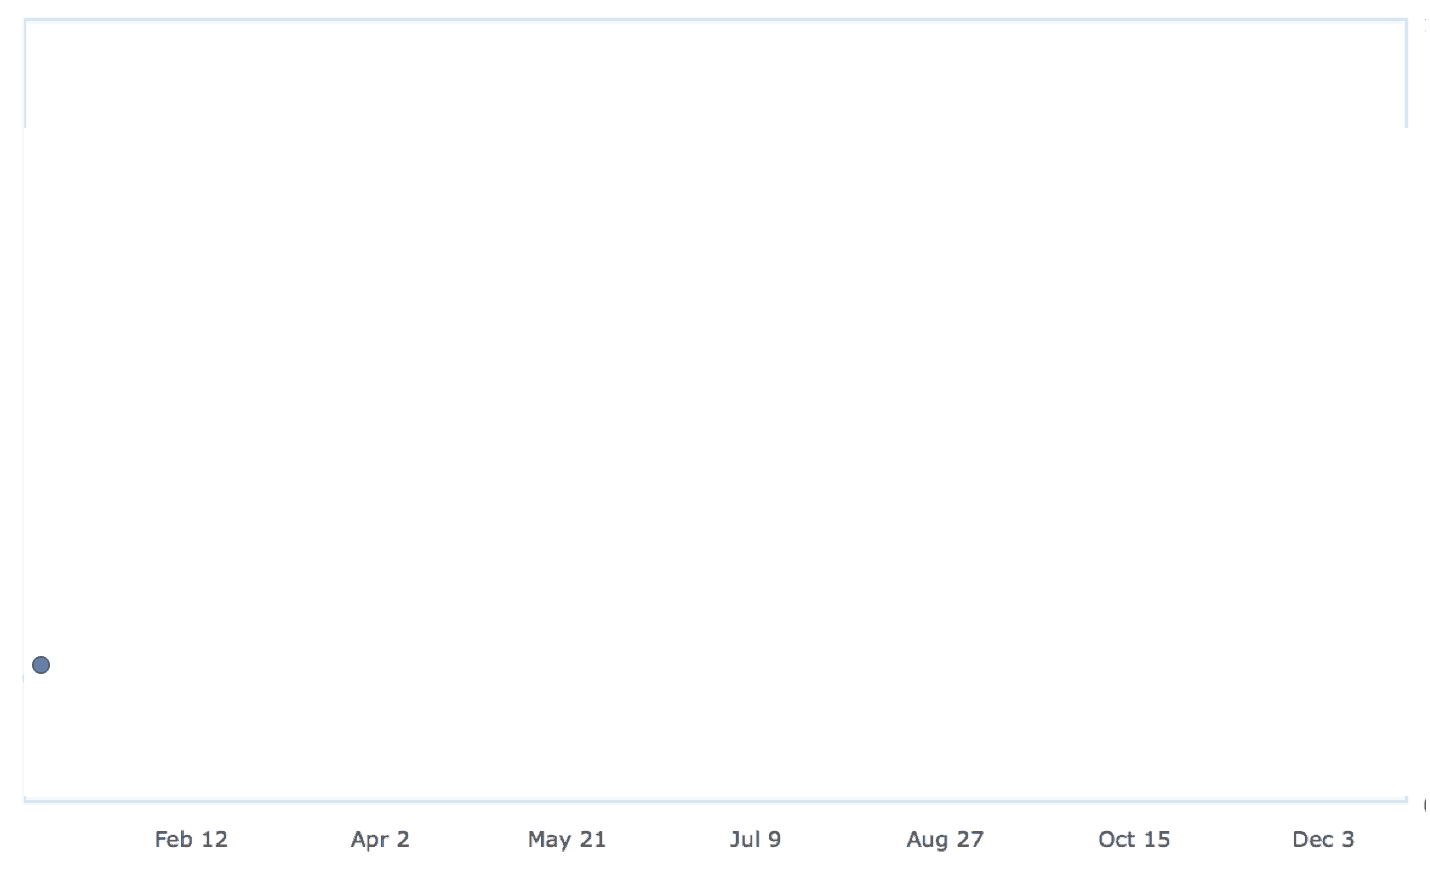
Now that 2018 has started, I don't want to see a blank chart with just one or two data points as January starts and progresses.
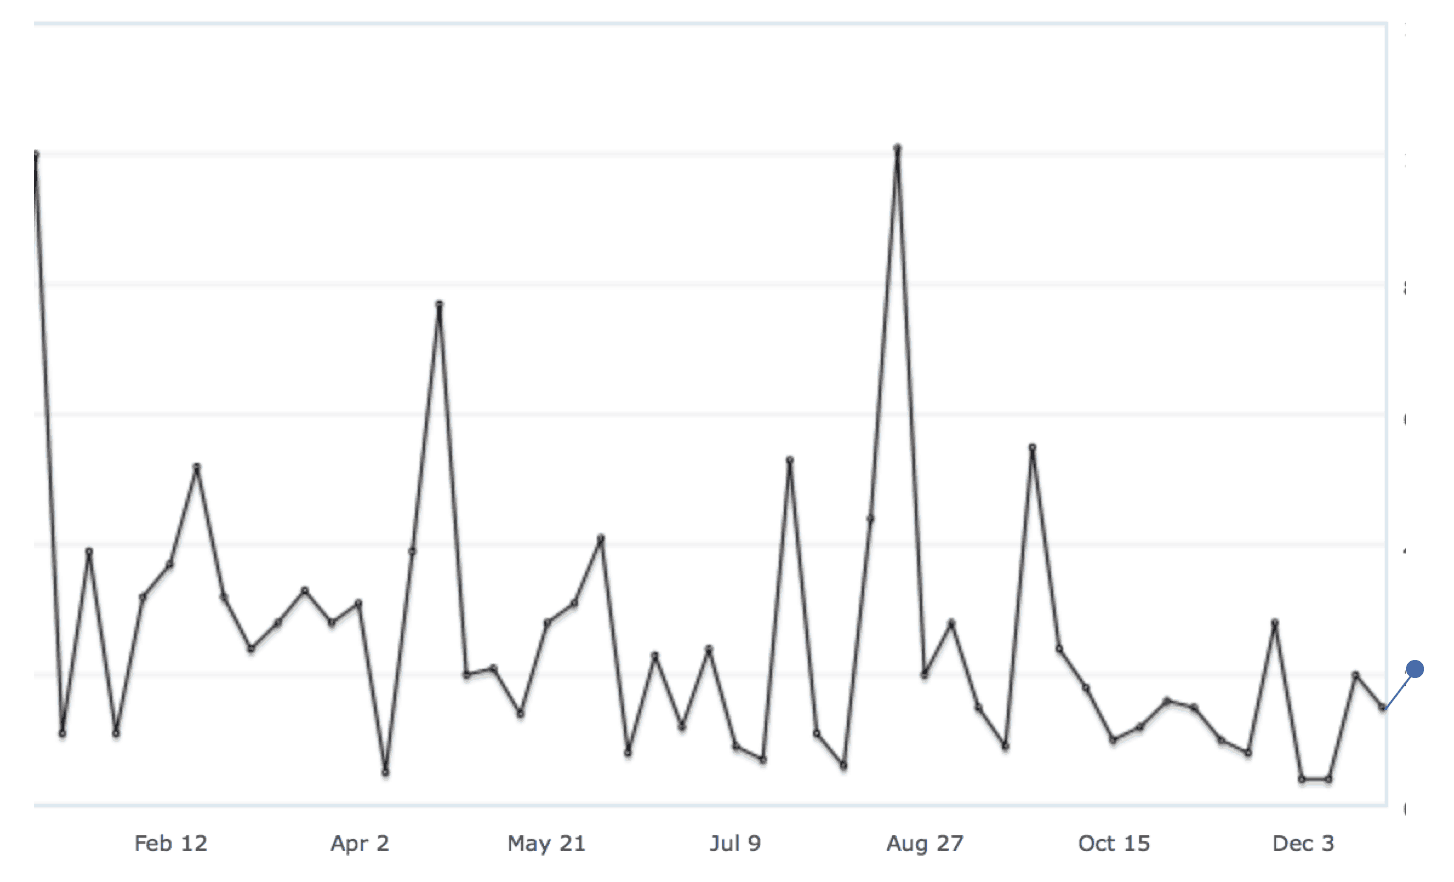
Amazon does what I would prefer… they add new data points to the chart. I can choose to view the last 52 weeks. As we add a data point, one data point is dropped. I can also view “all historical data” for even more context if I choose (which is what I normally look at).
This chart, with the first data point of 2018 added and the oldest data point removed, would be helpful:
This chart, with just one data point for the new year… not as helpful:
If part of the purpose of having a metric is to ask, “are we improving?” then you shouldn't just throw out the previous year's data in a big batch at the start of the year.
Your new year is most likely the continuation of last year's system. I'd suggest your charts and metrics should reflect that.
What do you think?
What does your organization do? What do you think they should do?
Learn more in my book Measures of Success: React Less, Manage Better, Improve More. Get a free PDF preview here.
Please scroll down (or click) to post a comment. Connect with me on LinkedIn.
Let’s work together to build a culture of continuous improvement and psychological safety. If you're a leader looking to create lasting change—not just projects—I help organizations:
- Engage people at all levels in sustainable improvement
- Shift from fear of mistakes to learning from them
- Apply Lean thinking in practical, people-centered ways
Interested in coaching or a keynote talk? Let’s start a conversation.


Comment from LinkedIn:
Another LinkedIn Comment:
FULLY agree, Mark. As long as the System itself has not been changed, continuation of data is best. And I would argue that even if the System has been changed, better continue with the data to see if things are better or worse after a suitable time.
I am reminded about that need (period of time to go by) by the wild weather the world is having and the brutal cold on the East Coast right now and the hottest summer on record out here in Western Washington State. Complexity Science teaches that when there is a disturbance in the System, there will be greater initial oscillation until a new level of System equilibrium is achieved. But, every System has some volatility, just much less when stability has been achieved.
More of the discussion from LinkedIn last year: