


There's a great Taaichi Ohno quote that I was reminded of last week (see a previous post from 2010 on this).
“Data is of course important in manufacturing, but I place the greatest emphasis on facts.”
I was in northern Ontario and was going to be driving back across the border on Friday afternoon to fly home from Sault Ste. Marie, Michigan. A savvy local told me about the website that shows current wait times for the Sault International Bridge.
The bridge's website shows hourly wait times, so we could call this “data” (numbers on a website):
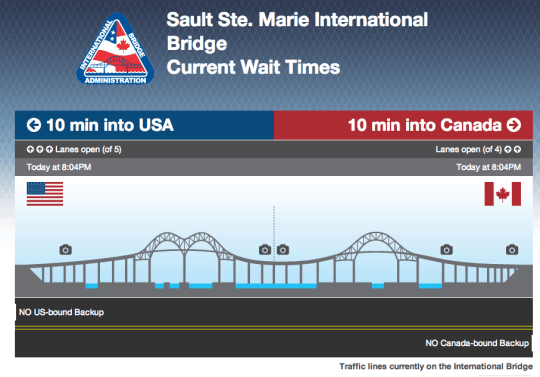
Sunday night, as I type this, isn't a really busy time with long waits. But, on Friday afternoons, the waits can be as much as an hour. I was hoping to avoid sitting on a bridge for an hour (even with the pretty view of the Soo Locks). If the wait was long, I could reduce my “waste of waiting” by eating dinner on the Canadian side and then driving back across once the wait was down.
You can see the forecast times (based on the last 12 months) for a Friday afternoon:
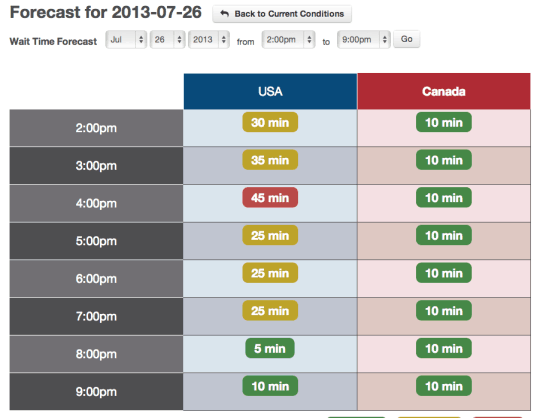
I was better off waiting until 8 PM, when there were just a few cars ahead of me, instead of coming across at 4 or 5 PM.
That's what the data say.
But what about facts? Facts, in this context, are things we can observe with our own eyes. We can apply this in the workplace. Let's say we have a report or an email from a manager that says hourly rounding on patients is happening 75% of the time. We could trust that data, as a senior leader, but that data might also be inaccurate (either due to data quality issues or because somebody is fudging the numbers).
I think Ohno would recommend not just relying on reports and data, but occasionally going to the “gemba” to observe first hand. Do we see nurses and techs completing hourly rounding (actually doing it) and recording it as they go? If we walk to a unit at 2 PM, have all of the hourly check boxes been filled out?
It's possible that the boxes are checked on the hourly rounding sheets that are posted outside of each room, but a check box doesn't mean it's actually happening. I was at one hospital last year where a patient care tech admitted to going around at the end of the day and filling in all of the empty boxes.
This tech clearly wasn't taught the “why” behind the hourly checklist. The point is not to have a filled out checklist – the point is the ensure that patients are checked on at least every hour. The tech wasn't being intentionally deceitful – she honestly didn't know any better (this is a system problem that we can't blame an individual for).
If a tech is fudging the numbers (filling in the checklists), we might have data that says hourly rounding is done 100% of the time. But are the data accurate?
Perhaps we take the “trust, but verify” approach of President Reagan?
Maybe the International Bridge data isn't accurate (again, due to data quality issues or because somebody is under pressure to fudge the number ). Somebody responsible for the bridge might have an annual bonus that depends on average bridge wait times, so they have a financial incentive to cheat?
This is where the live webcam of the bridge comes in.
The savvy local was incredibly savvy when she recommended that I look at the webcams in case the data weren't accurate. The wait time data could have a time lag (a data quality issue, not something intentional).
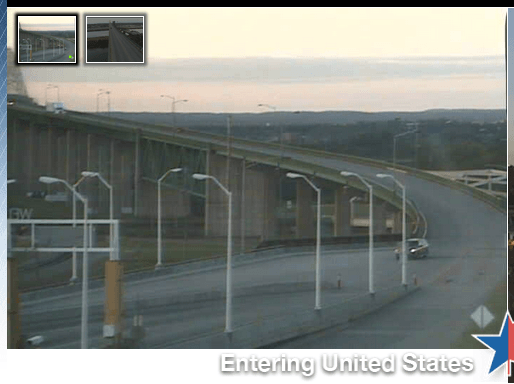
Locals who cross this bridge a lot know what a 30-minute wait looks like on the bridge. Regardless of what the data say, they use their own eyes (or, in this case, a webcam's).
Please scroll down (or click) to post a comment. Connect with me on LinkedIn.
Let’s work together to build a culture of continuous improvement and psychological safety. If you're a leader looking to create lasting change—not just projects—I help organizations:
- Engage people at all levels in sustainable improvement
- Shift from fear of mistakes to learning from them
- Apply Lean thinking in practical, people-centered ways
Interested in coaching or a keynote talk? Let’s start a conversation.


")


