Search Results for two data points not a trend

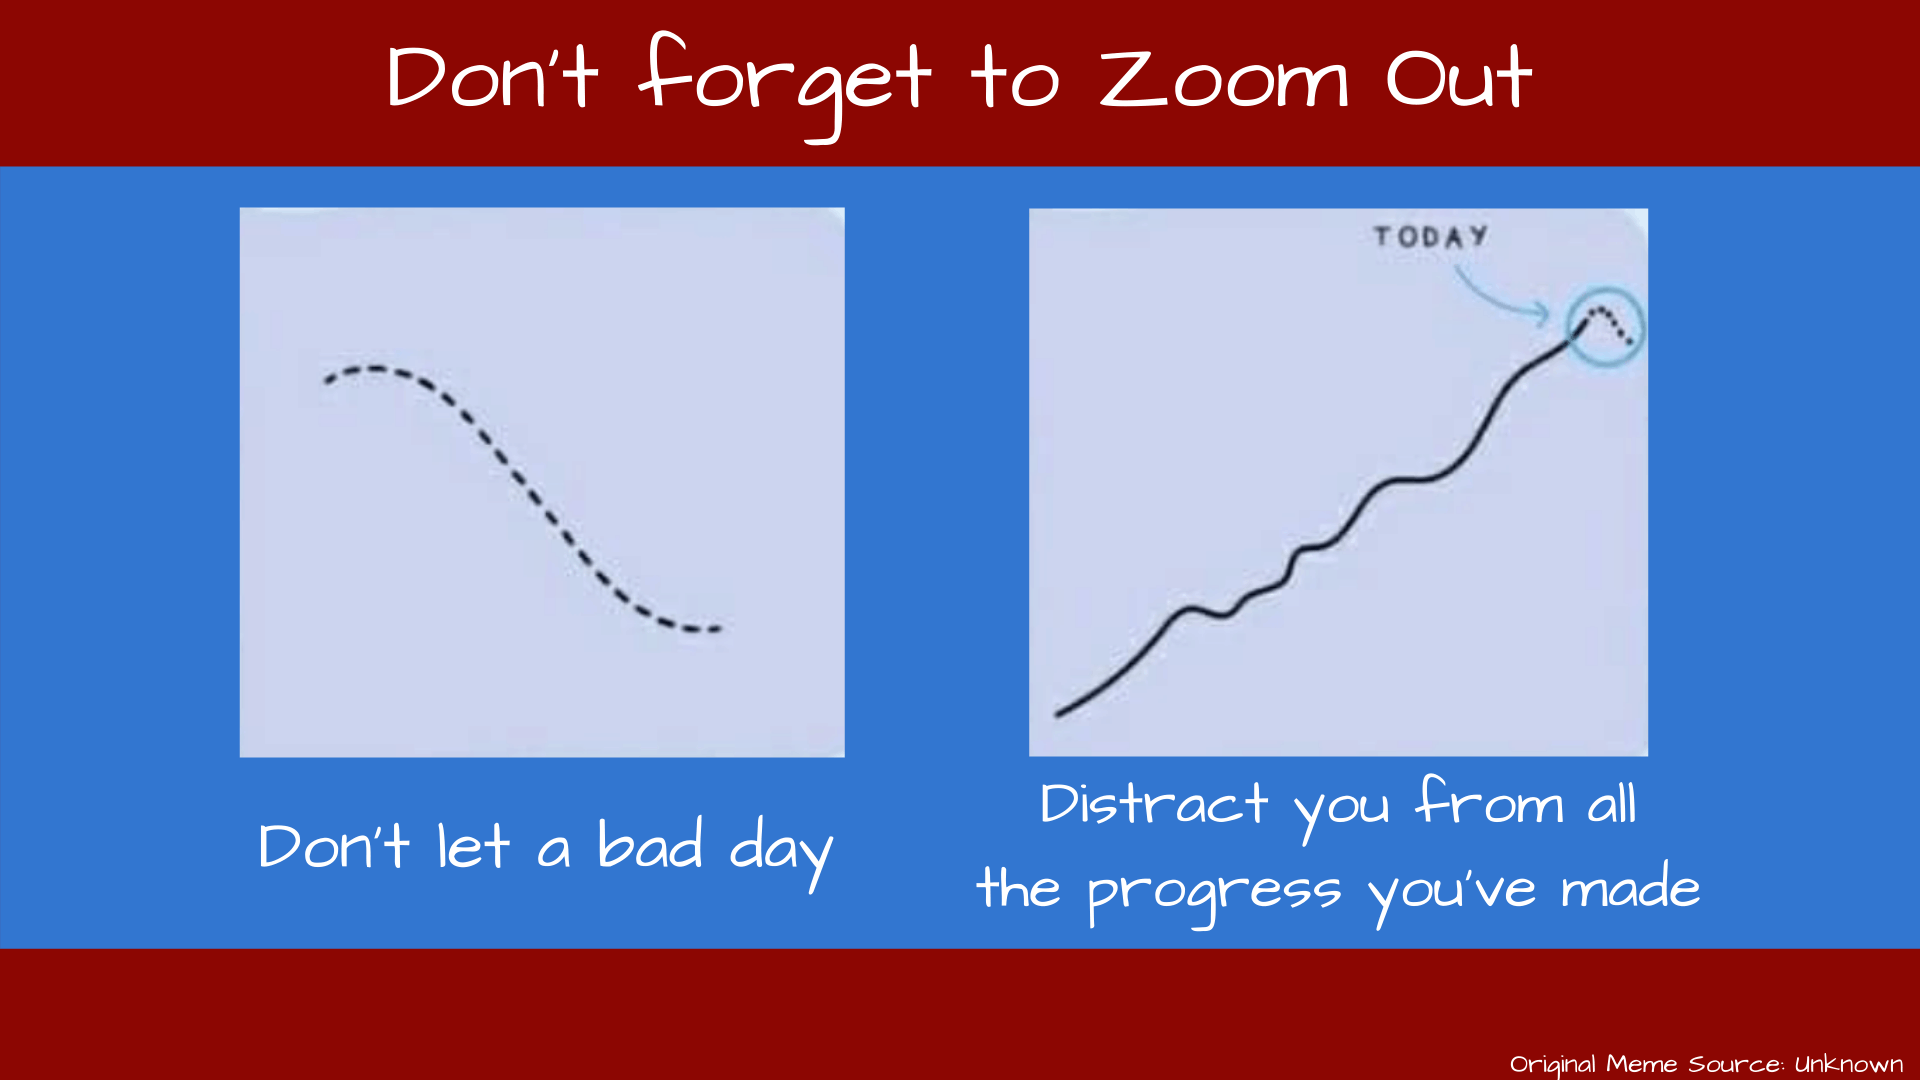
Zoom Out For The Whole Picture

Mark’s note: Today’s post is something I asked my friend Brian Buck to write up here. He wrote one previous guest post back in 2010. For context, Brian had shared the following on LinkedIn: I shared an example from some…

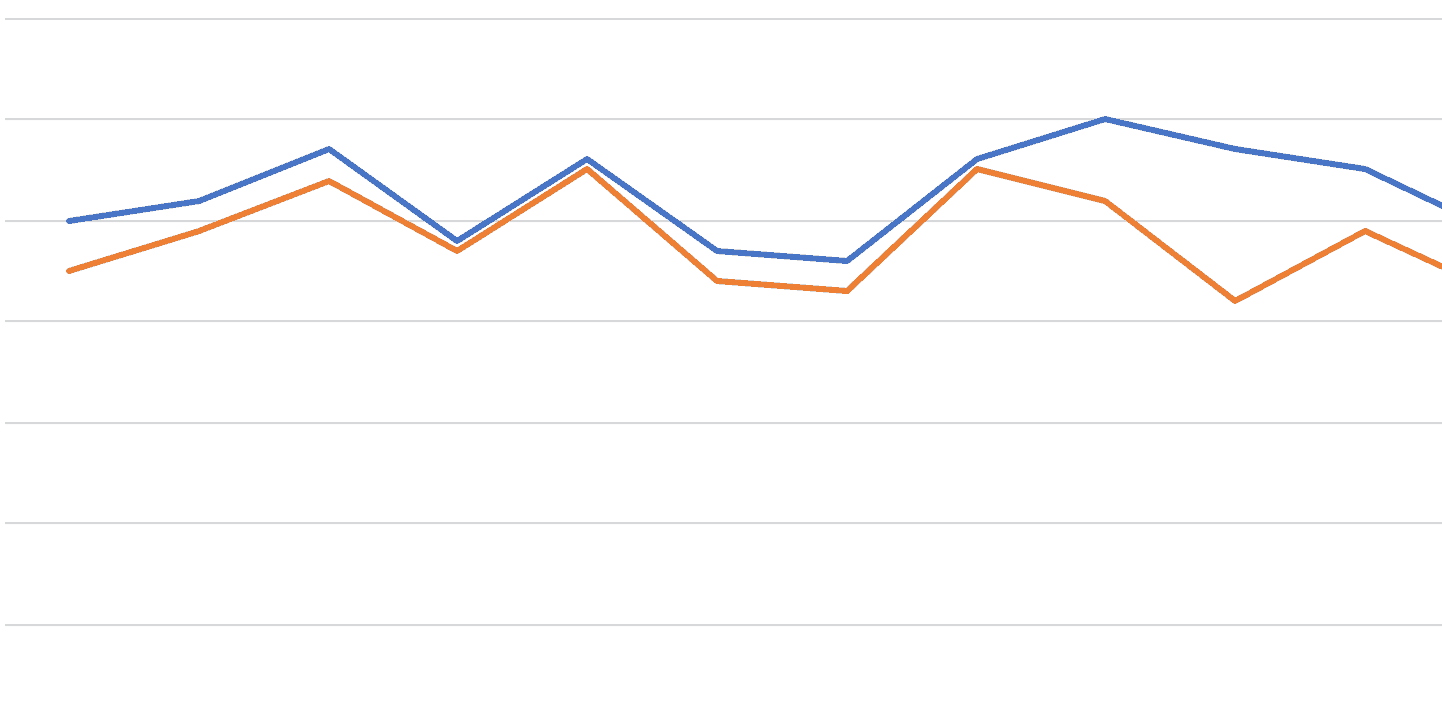
Why Year-Over-Year Charts Often Mislead Leaders

TL;DR: Year-over-year charts look analytical, but they often hide routine variation and invite overreaction. Process Behavior Charts make real improvement–and real risk–visible without guesswork. The main subject of my book Measures of Success is “Process Behavior Charts” (see more in…