


In my book Measures of Success, I share what I've learned about the “Process Behavior Chart” methodology for management metrics and business performance measures. In this post, I'll connect these methods to an example from the world of sports — particularly “perfect games” pitched in Major League Baseball.
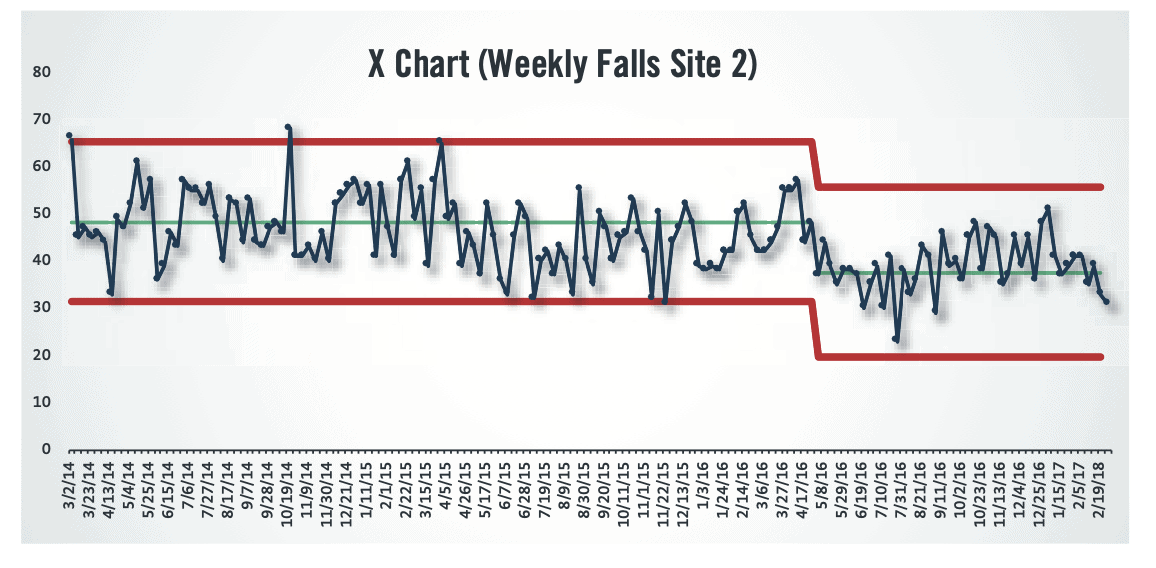
I love this methodology and use it whenever I can. In most cases, we are charting a measure on a daily, weekly, or monthly interval. That might be a data point like “average patient waiting time” or “number of customer complaints.” Or patient falls, with an example chart from the book. In that example, the number of falls per week has shifted down, showing evidence of some step function improvement.
As I wrote in the book, the PBCs can get a little wonky when we have rare events (or events that should be rare, like medication mistakes).
“As a hospital reduces falls (or when any organization reduces hopefully rare events like server crashes or defects reaching a manufacturing customer), the average number in a period might fall below one. In special cases like this, charting the number of rare incidents can be a bit problematic.
In the X Chart, below, since the average number of infections per week is just 0.13 and the Upper Limit is calculated to be 0.86, any week with one infection appears to be a signal. We could, in this case, investigate each infection's root cause.”
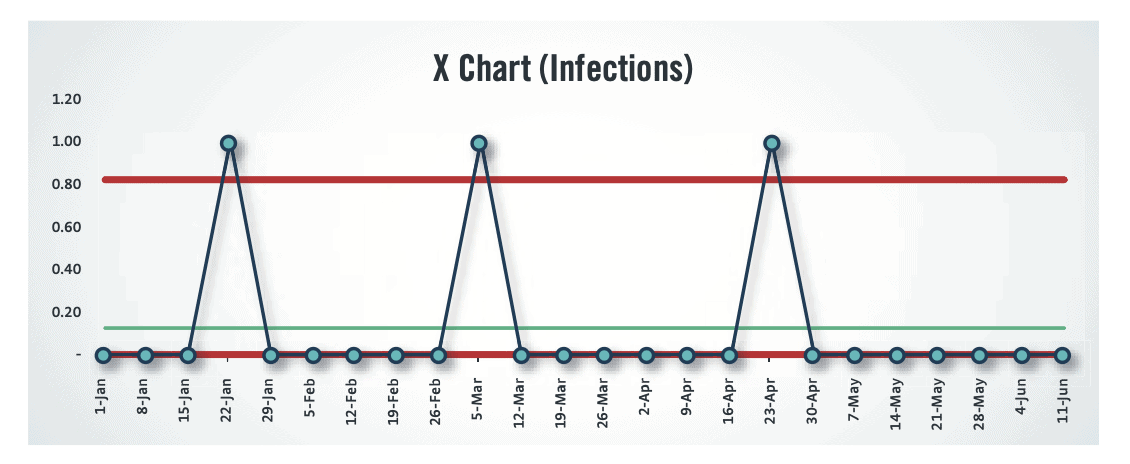
“An X Chart with such a low average makes it difficult, however, to predict future performance or to tell if we are improving. We could look for eight consecutive weeks of zero infections (Rule 2). Or, we can instead plot the days between infections as a metric, where each data point is a particular incident. Such a chart would look like the one below, where we see that the days between infections is a predictable metric that is fluctuating around an average of 49.5 days. The last three data points show a Rule 3 signal that would indicate that infections are becoming more frequent — therefore, we should investigate and try to correct whatever has changed in the system.”
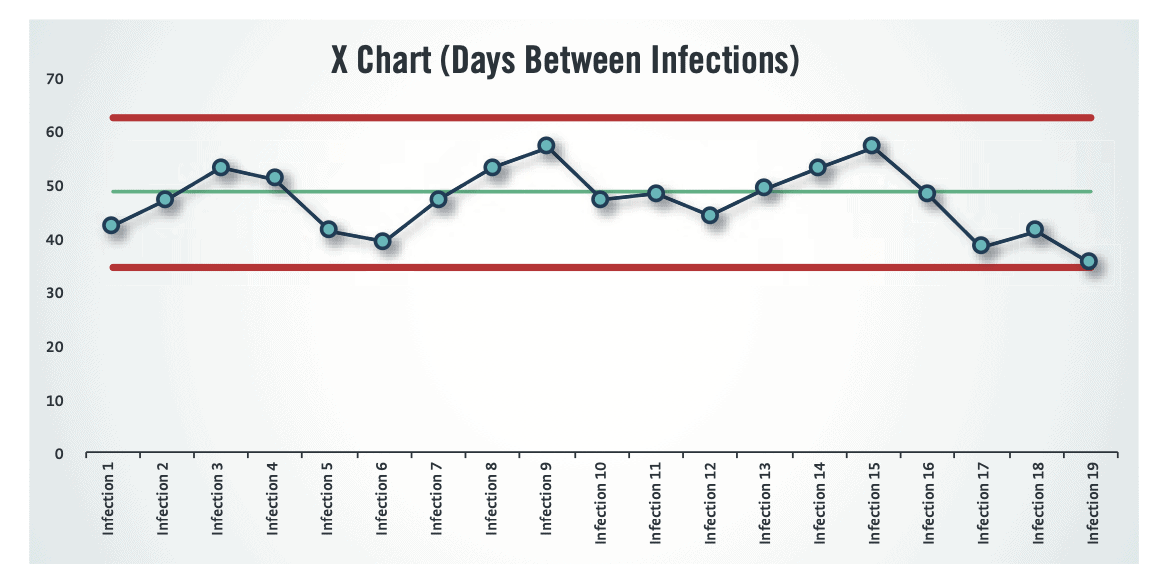
“Hopefully, we could improve the system to further increase the average days between infections, using the PBC as a way of proving that we've improved.”
MLB Perfect Games
One of the rarest events in Major League Baseball is the “perfect game,” where a pitcher successfully retires all 27 batters faced (no hits, no walks, no batters hit by a pitch, no fielding errors — or anything else that allows a runner to reach base).
This has happened just 24 times over 154 years – out of more than 235,000 games ever played. You'll see a perfect game, on average, about one out of every 10,000 games played.
If we were to chart the number of perfect games per season, would we end up with a chart where any year with a perfect game was a “signal” in the chart? Not quite:
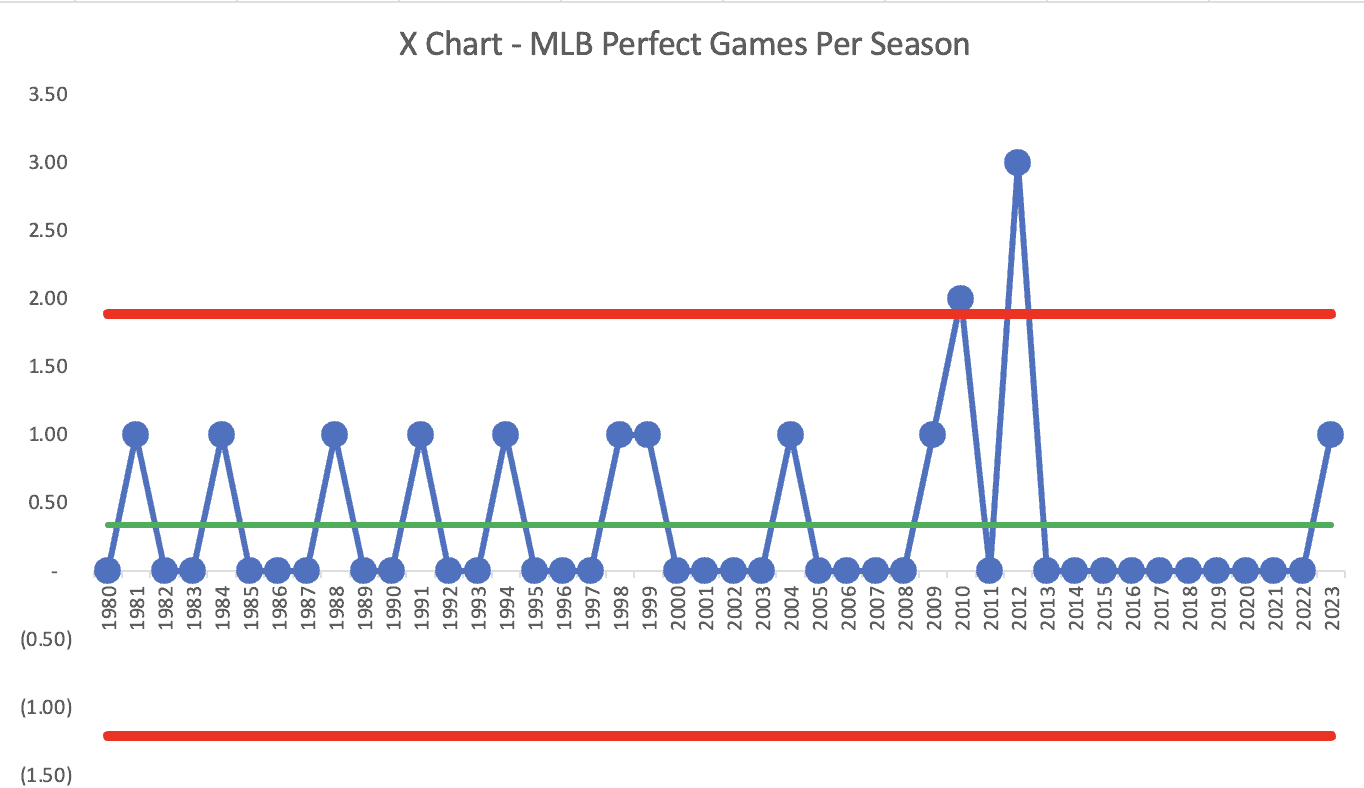
I'm not sure what useful information comes from this chart. I don't think the commissioner of MLB is trying to actively manage anything here. It's interesting to see a cluster of perfect games in the 2009 to 2012 seasons (six of them) and then going 11 years without one.
But that's the nature of charting “rare events” (as my MIT statistics professor Arnie Barnett discussed, in the context of plane crashes, in an episode of the “My Favorite Mistake” podcast).
But this is an application for charting “days between perfect games” if we wanted — to practice the method, I guess.
I asked ChatGPT to generate a list of perfect games with the number of days in between. Oh, and I was prompted to think about this because the 24th-ever perfect game was thrown recently by Domingo Germán, of the New York Yankees, on June 29th (something ChatGPT didn't know).
The List of Perfect Games:
Lee Richmond (Worcester Ruby Legs) – June 12, 1880 – 0 days
John Montgomery Ward (Providence Grays) – June 17, 1880 – 5 days
Cy Young (Boston Americans) – May 5, 1904 – 8,076 days
Addie Joss (Cleveland Naps) – October 2, 1908 – 1,636 days
Charlie Robertson (Chicago White Sox) – April 30, 1922 – 4,869 days
Don Larsen (New York Yankees) – October 8, 1956 – 12,497 days
Jim Bunning (Philadelphia Phillies) – June 21, 1964 – 2,799 days
Sandy Koufax (Los Angeles Dodgers) – September 9, 1965 – 446 days
Catfish Hunter (Oakland Athletics) – May 8, 1968 – 972 days
Len Barker (Cleveland Indians) – May 15, 1981 – 4,743 days
Mike Witt (California Angels) – September 30, 1984 – 1,240 days
Tom Browning (Cincinnati Reds) – September 16, 1988 – 1,444 days
Dennis Martinez (Montreal Expos) – July 28, 1991 – 1,029 days
Kenny Rogers (Texas Rangers) – July 28, 1994 – 1,101 days
David Wells (New York Yankees) – May 17, 1998 – 1,401 days
David Cone (New York Yankees) – July 18, 1999 – 428 days
Randy Johnson (Arizona Diamondbacks) – May 18, 2004 – 1,787 days
Mark Buehrle (Chicago White Sox) – July 23, 2009 – 1,889 days
Dallas Braden (Oakland Athletics) – May 9, 2010 – 656 days
Roy Halladay (Philadelphia Phillies) – May 29, 2010 – 20 days
Philip Humber (Chicago White Sox) – April 21, 2012 – 692 days
Matt Cain (San Francisco Giants) – June 13, 2012 – 53 days
Felix Hernandez (Seattle Mariners) – August 15, 2012 – 63 days
Domingo Germán (New York Yankees) – June 29, 2023 – 3965 days
The first “major league” game was played May 4, 1871, so that was 3327 days before that first perfect game.
Then, here's the wild thing — there was another perfect game FIVE days later. The average time between perfect games is 2225 days. But, look at the variation. There were two prefect games in the month of May 2010.
But let's look at the Process Behavior Chart. This chart below shows the days between perfect games. Each data point is a game and the # of days since the last one (or days since the first-ever game).
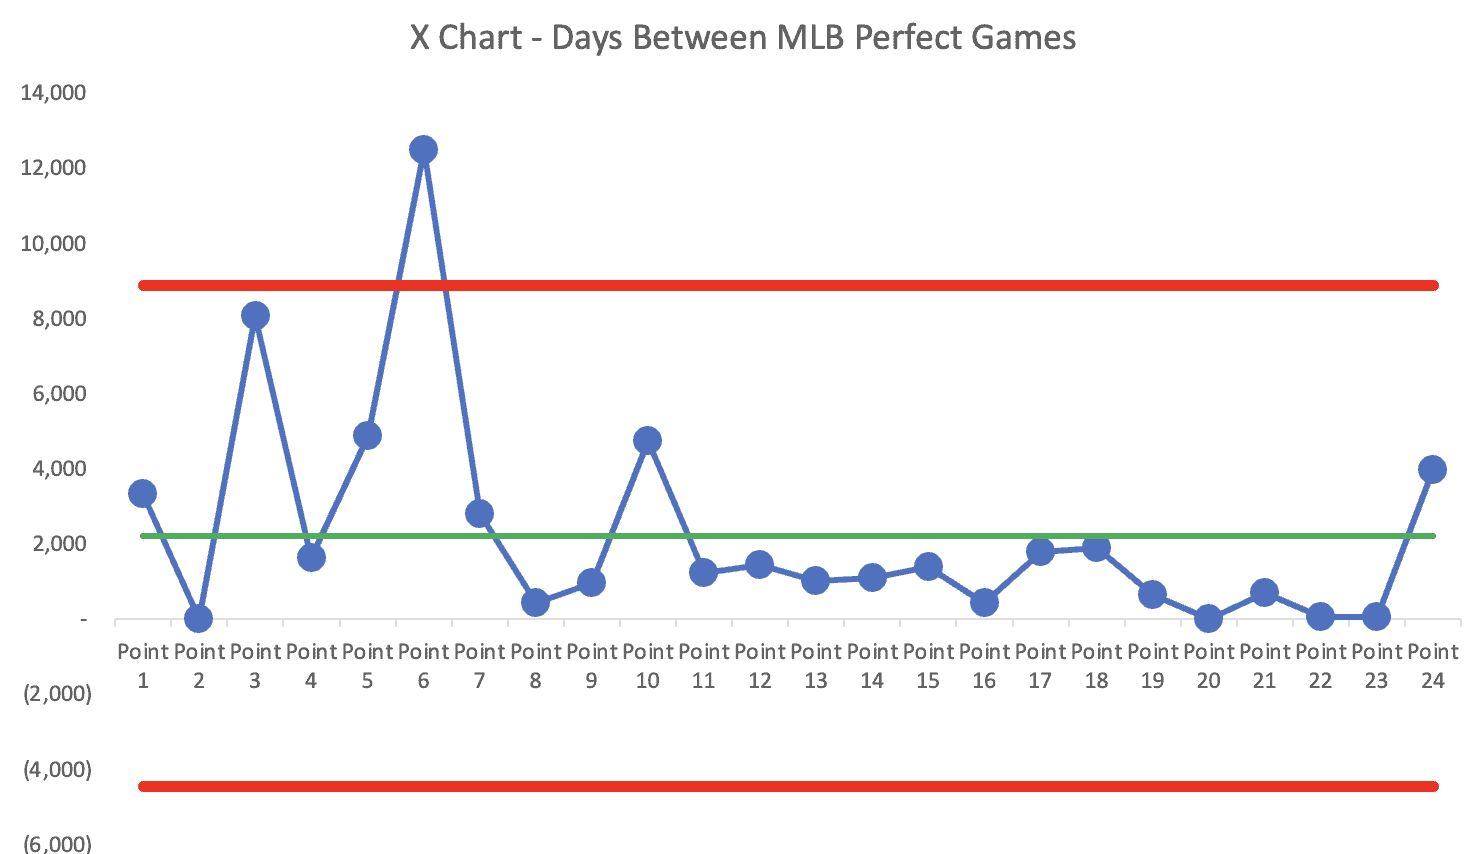
People talked about how long the stretch had been since the last perfect game in 2012. That's only the fourth-longest stretch without a perfect game. The longest stretch without a perfect game was 34 YEARS! And that was broken by the only perfect game ever thrown in the World Series (Don Larsen).
The average days between perfect games, all time, is calculated to be 2225 days.
But we do see, in the chart, that starting with the 11th perfect game (Mike Witt, September 30, 1984), there are 13 consecutive perfect games where the days between was less than the baseline average. There's apparently been a shift in the system where perfect games are happening more often than they did before 1984.
I recalculated the average and limits to illustrate the shift:
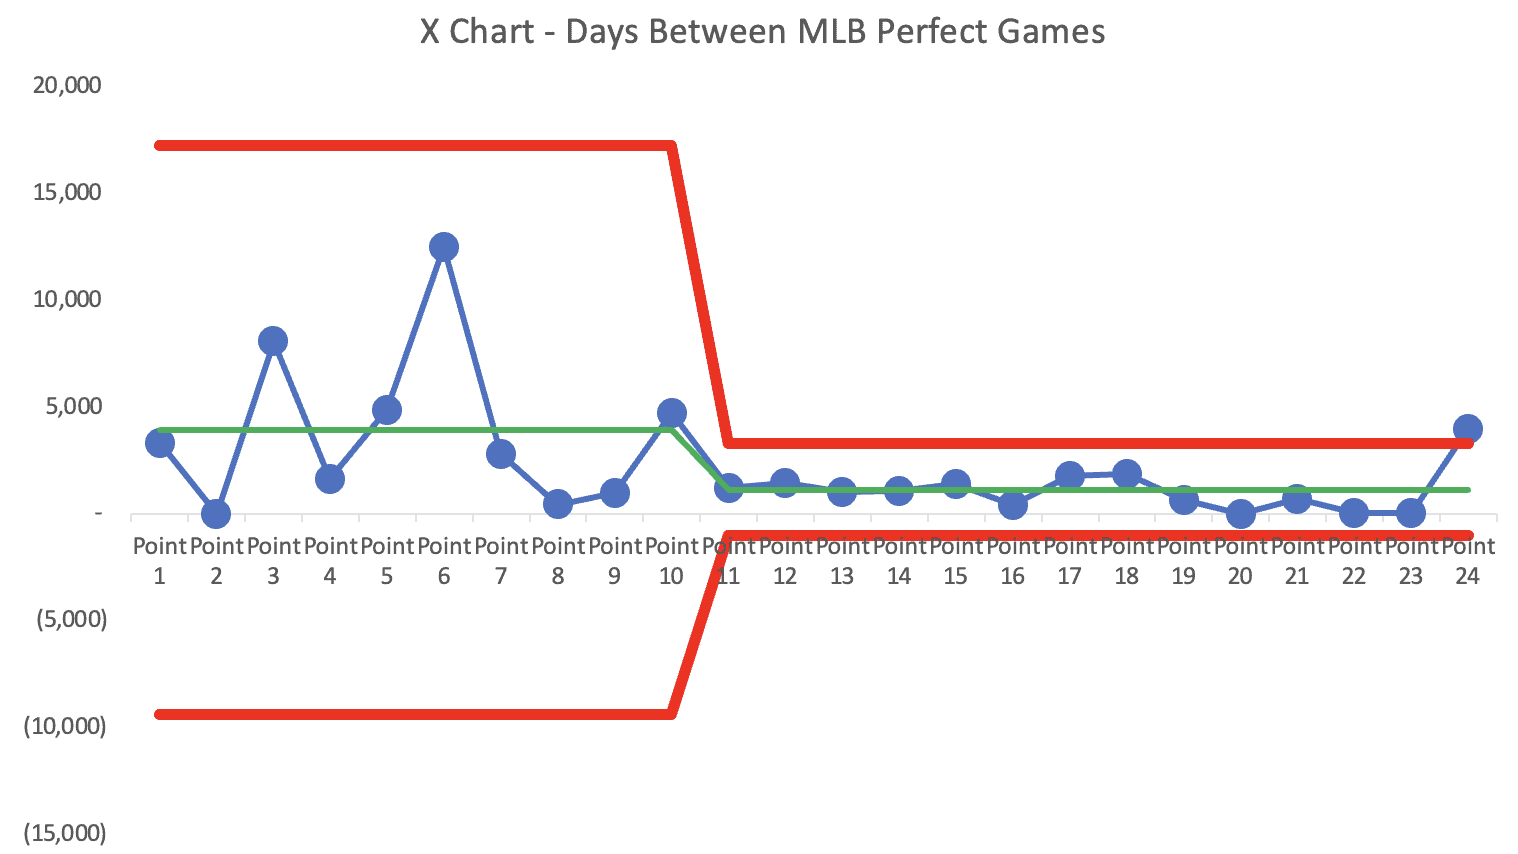
The original average days between perfect games was about 4000 days. 1984 on, that average has been just 1126 days.
The most recent time between perfect games is above the upper limit. This was an outlier… but what was the cause? Does it matter? Again, this is just an exercise illustrating how to use the charts. I hope they are useful to you in your workplace.
The Mistake That Ruined a Perfect Game in 2010
See this blog post that I wrote at MistakesBook.com:
The Umpire's Mistake That Ruined a Perfect Game in 2010

Please scroll down (or click) to post a comment. Connect with me on LinkedIn.
Let’s work together to build a culture of continuous improvement and psychological safety. If you're a leader looking to create lasting change—not just projects—I help organizations:
- Engage people at all levels in sustainable improvement
- Shift from fear of mistakes to learning from them
- Apply Lean thinking in practical, people-centered ways
Interested in coaching or a keynote talk? Let’s start a conversation.


