


I was asked to write this article for recruiter.com, which I am reprinting here with their permission.
Younger Workers Crave Instant Gratification. Here's How to Give It to Them Without Causing Distraction.
OK, I'm squarely “Gen X” but I was asked to run with the idea that Gen Z “craves instant gratification.” As with any real-time metrics, there's a risk of overreaction and poor evaluation of performance… which also begs the question of evaluating an individual vs. the system, something not explored in this piece.
Gen. Z workers want immediate access to data that shows them how they're performing. That's one reason many companies — like Accenture, Microsoft, and Adobe — are doing away with traditional performance reviews. Annual cycles are just way too slow for today's workers, among other problems.
Younger workers have grown up with expectations of instant gratification. They're used to having everything they've ever needed at their fingertips thanks to smartphones, and this craving for instant gratification carries over into their work lives. Instead of waiting until the end of the game to learn the score, Gen. Z employees want immediate access to their real-time performance data. After all, that's the only way they can make adjustments and improve their performance before the game is over.
But while more timely data can be useful to Gen. Z-ers, overreacting to every uptick or drop in a metric leads to a lot of wasted effort and gets in the way of business success. The trick is to give young employees their data points, but also teach them how to avoid overreacting.
Real-Time Data Without the Distraction
Let's say Riley is the marketing director for a recruiting firm. One of her goals is to increase traffic on the company website, and her future pay raises and possible promotions depend on it. Web traffic is, thankfully, easily measured, and Riley gets an email from Google Analytics each month that shows the number of users and how much that number has changed from the month before.
Two data points are not a trend, and all the Google email does is compare one data point to the last. If the number of users is down 2.2 percent from the previous month, it's really hard to evaluate that percentage change without better context. Searching for the older Google emails, Riley sees that traffic was up 16.7 percent the previous month. Riley might be tempted (or pressured by the CEO) to ask why growth has turned into decline. Riley would then spend a few hours investigating, looking for a root cause for the decline in the number of users.
It's a fact that a negative 2.2 percent is worse than a positive 16.7 percent, but again, it's just two data points. How much does that number normally fluctuate each month over time? A better question to ask would be, “Has the number of users changed in a way that is statistically significant?” If the recent decline in users is not statistically significant, looking for a root cause is a distraction, if not a waste of time.
Let's say you step on the scale at the same time each morning. Even if your weight is pretty stable over time, you're not going to weigh the exact same amount each day. Many of us learn to shrug off small fluctuations in our weight, looking instead for more meaningful trends. We can do the same with the way we keep score at work.
The first thing Riley could do differently is log into Google Analytics to see the number of users by week (or even by day). Google Analytics will, by default, visualize the numbers as a run chart, a method that makes it far easier for Riley to see trends in how the number of website visitors has changed over time. Here's an example:
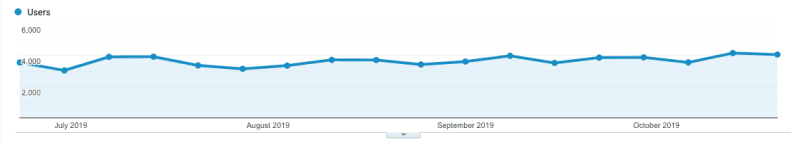
When we step back from looking so closely at each data point, trends (or the lack thereof) across a longer time frame might appear. Riley sees, in the chart, that this metric goes up some weeks and goes down others — a helpful insight into the metric's performance.
A slightly more sophisticated approach would be to use a spreadsheet to create a process behavior chart from the data, a method I teach in my book, Measures of Success. In addition to the data, Riley would calculate the average weekly number of visitors, and a line would be added to the chart, shown below in green. Riley would also calculate the lower and upper limits, adding two more lines to the chart (shown below in red), so it looks like this:
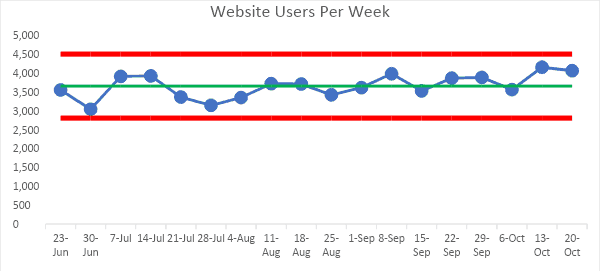
Again, this chart makes it look like the number is fluctuating around an average of about 3,500. Any single data point outside of the limits (outside of the red lines) would be a signal that web traffic has changed significantly. Any single data point between the red lines is just noise in the system. Freed of the need to explain every up and down, Riley is now able to spend time working on things that might attract more users to the website, such as creating new content.
Another signal that a metric has shifted significantly would be finding eight consecutive data points above the average. In fact, the last eight data points almost meet that criteria. As additional weeks go by, Riley (and the CEO) will see additional data points. The number might continue fluctuating around the average — or with the right efforts in place to increase (and not just explain) web traffic, they might see a signal that shows an increase.
A methodology like this shows there's no need to wait months (or until the end of the year) to tally up the numbers and evaluate performance. I stand with Gen. Z when I say, “Give me more numbers, more quickly — but also teach me how to react less and lead me more effectively, so we can improve more.”
Please scroll down (or click) to post a comment. Connect with me on LinkedIn.
Let’s work together to build a culture of continuous improvement and psychological safety. If you're a leader looking to create lasting change—not just projects—I help organizations:
- Engage people at all levels in sustainable improvement
- Shift from fear of mistakes to learning from them
- Apply Lean thinking in practical, people-centered ways
Interested in coaching or a keynote talk? Let’s start a conversation.


Great post, I think it is beneficial for all employees to receive positive feedback. If you’re only giving feedback on negative situations, an employee is going to feel disappointed in themselves and their work effort will lower. While, if they are receiving positive feedback as well then they can strive to work harder and more efficiently. However, if you are giving feedback on every little situation than it will no longer be effective. Thanks for sharing!