


I was reading this NFL preview article in the Wall Street Journal (which makes as much sense as getting business news from ESPN, I guess):
Why This NFL Season Is More Unpredictable Than Ever
In business, we'd love to have predictable results. One great benefit of a Process Behavior Chart is that it helps us see if a metric is just fluctuating or not. We might be upset, in a way, that a metric isn't improving, but if it's exhibiting nothing but “routine variation” then we can predict future performance — it's going to continue fluctuating between the Lower and Upper Limits, unless the system changes.
The one thing that can be hard to predict is: “Will the system change?”
Only more data points can answer that question.
The WSJ wrote:
“[Patriots quarterback Tom] Brady is 42, an age that sends him into uncharted territory: a quarterback 42 or older has never started more than 10 games in a season. And while his sixth ring may be strong evidence that he's a cyborg who can play forever, there are indications that isn't quite true.
He has declined in efficiency for three straight years, with his yards per attempt dropping from 8.2 to 7.6–a middle of the road figure. If that trend continues in 2019, he'll sink below the NFL average.”
It's a factual statement that his “yards per attempt” has gone down three straight years.
| 2016 | 9.3 |
| 2017 | 8.4 |
| 2018 | 7.8 |
The numbers are correct — but they lack context. For one, YPA is just one measure of “passing efficiency.”
As our friend Paul Critchley commented on LinkedIn:
“And in those three years the Patriots have appeared in the SB three times and won it twice. More evidence that perhaps more important than “you get what you measure” is “make sure you're measuring the right things”!”
The WSJ article is doing two things:
- Comparing his performance to the recent past
- Comparing his performance to others
A Process Behavior Chart is a perfect way of comparing Tom Brady's recent performance to the greater context of his entire career. Here is a PBC that I created (you can download it via Dropbox) — I excluded the first season (when he didn't play) and I also excluded the season where he was injured in his first game and didn't play the rest of the year.
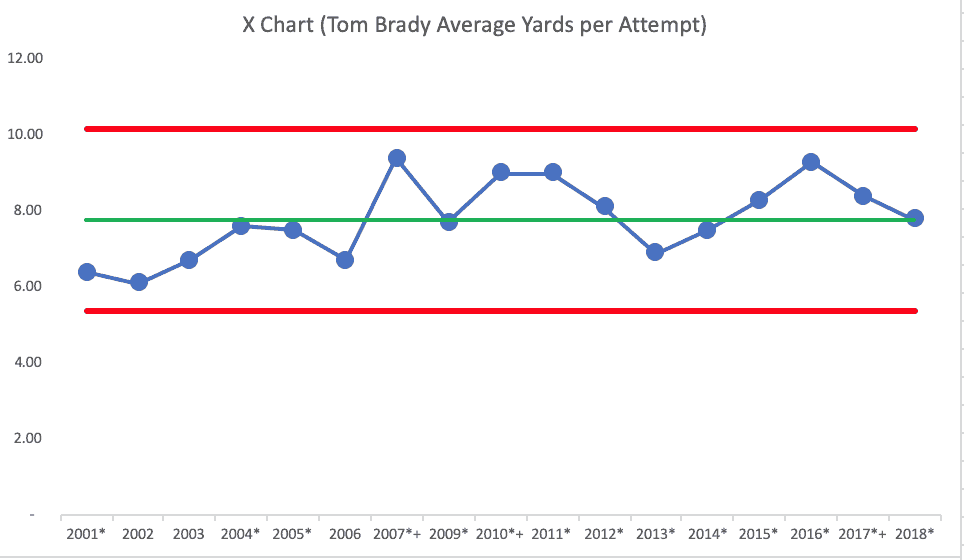
His career average is 7.79. The last three seasons have been above average. Is that a sign of decline?
Either way, Tom Brady is part of a SYSTEM. His performance depends on his teammates, the system and plays they are running, and the coaching.
The PBC shows no signs of any signals. His performance has just been fluctuating during his career.
Now, will it continue to just fluctuate? We don't know. A fourth straight year of decline, if that happens, is not a statistical signal either. If it drops below the calculated lower limit, will he get benched? Would he retire?
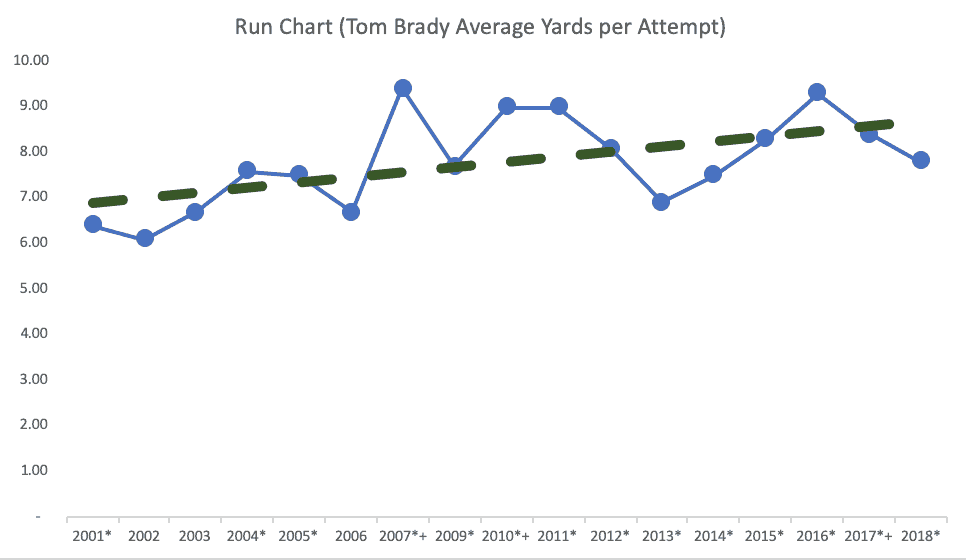
Only time will tell. But, I wouldn't spend any time explaining why his numbers have dropped in the past two years. We could also be asking why his performance is now BETTER than the earlier, younger years of his career? If we drew a linear trend line (a dangerous practice), it would show a clear INCREASE over time.
Here's the LinkedIn post that I did yesterday that has a lot of discussion already:
What do you think? Do you see similar discussion about “trends” that might not really be trends in your organization?
Please scroll down (or click) to post a comment. Connect with me on LinkedIn.
Let’s work together to build a culture of continuous improvement and psychological safety. If you're a leader looking to create lasting change—not just projects—I help organizations:
- Engage people at all levels in sustainable improvement
- Shift from fear of mistakes to learning from them
- Apply Lean thinking in practical, people-centered ways
Interested in coaching or a keynote talk? Let’s start a conversation.


Once again another article that has to do with football that grabbed my attention. We know that Brady is arguably the best quarterback to play the game of football and the stats and trends sometimes do not justify how good he is as a football player. However, you can also relate this to business. When looking at the trend above people usually tend to look at the number and not everything in the background. As you mentioned Brady is part of the system and the system changes. The performance of the team, from a holistic approach, usually helps guide how the statistics and trends look for Brady. From a business perspective, this is the same idea. Analysts generally do not look at the business from a holistic approach when making claims. People need to look at all of the metrics that go into the trends and then they can base their statements from there.