


Quite often, I used the famed “Red Bead Game” (a.k.a. the “Red Bead Experiment”) that was made famous by W. Edwards Deming.
Here are my previous blog posts about the game. You can also see my page with more resources about the game, Deming, and more.
Chapter 5 of my book Measures of Success: React Less, Lead Better, Improve More is a narrative of the game and the lessons learned in workshops where it's used.
In the game, one management fallacy that's exposed is threatening to punish or fire people whose performance is the result of “the system.” In the game, setting an arbitrary goal of “3 red beads” doesn't mean it's achievable.
Firing the bottom half of our performers (or firing the “bottom 10%” if we had ten “willing workers” wouldn't be fair and it wouldn't improve performance to bring in a replacement worker to work in the same badly-designed system.
Here is the scoresheet from the game when I facilitated this last week. After the third round, the bottom half of performers were fired. It was a “performance-based culture” and a “data-driven decision,” after all (an organization might say).
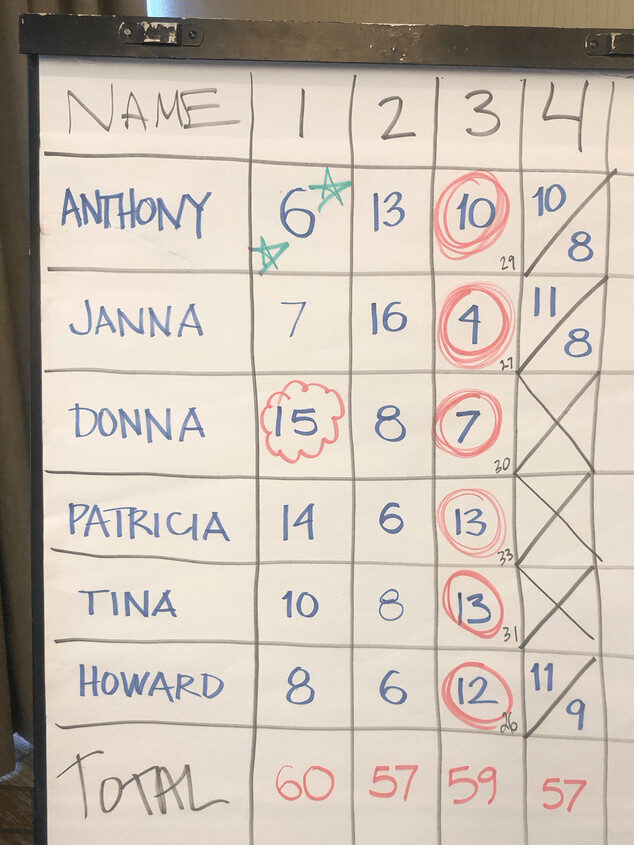
When “willing workers” dip their paddle into the container, they “produce” 50 beads and red beads are considered “defects.” It looks like this:

The expected average number of red beads on the paddle after each round of production is 10. Since each round has six workers, the totals of 60., 57, 59, and 57 show some of the inherent
In the game, we're not doing anything to really improve the underlying system, so we'd expect the variation in results to be somewhat consistent. But there's always going to be variation.
The problem is that the round-to-round variation is much higher for each individual worker. The variation is high enough that it would be tempting to blame workers for their bad performance. But, in this case performance is absolutely driven by the system, which includes variation in the distribution of the red beads in the container (it's not a random-number generator).
The “Process Behavior Chart” that shows each individual paddle shows that the results are a “predictable system” with variation:
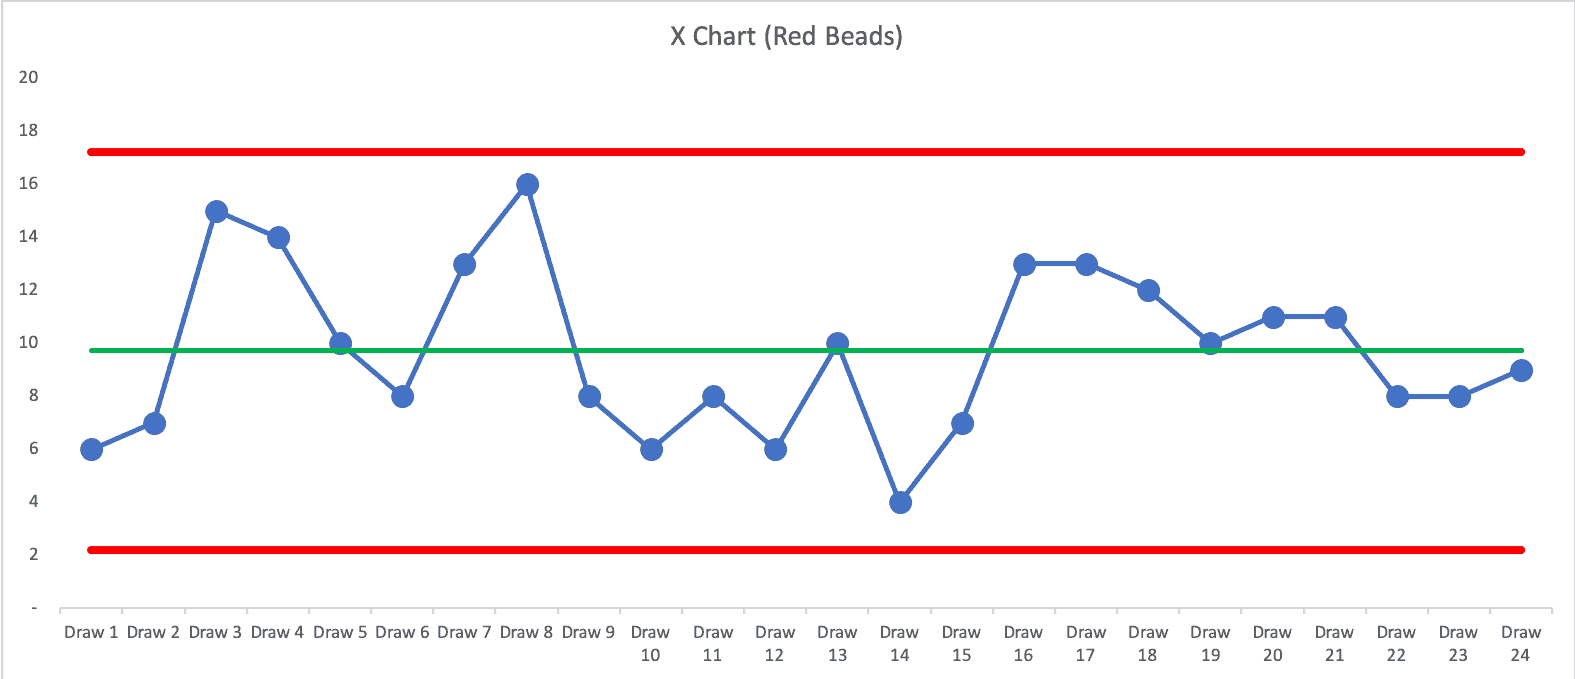
There's nothing but “noise” in those results. There's no reason to ask, “Why did you only get four reds? anymore than it's worth asking, “Why did you get 16?”
The same system generates all of those results. Rewarding, judging, or blaming people for random performance is ineffective, if not cruel.
In this post from last December, I wrote about how Process Behavior Charts could be used to compare individuals (or teams or sites) and their performance at a snapshot in time.
We can use Process Behavior Charts to see if the performance we attribute to an individual is within the range of “routine variation” or if their performance is somehow an outlier.
In the Red Bead Game, everybody is doing the same work the same way. I observed them and there was no cheating. Just a lot of hoping and wishing for better results.
When we compare the average number of red beads from each “willing worker,” we see that their performance is all within the same range. The results are driven by the system.
The average number of red beads by each per person look like this as a table of numbers:
| Name | Average |
| Anthony | 9.4 |
| Janna | 9.2 |
| Donna | 10.0 |
| Patricia | 11.0 |
| Tina | 10.3 |
| Howard | 9.2 |
| GRAND TOTAL | 9.86 |
Would you assume that the organization would be better off if we fired the bottom three and then asked the three survivors to run double shifts? Why did Donna, Patricia, and Tina get more defects? BAD LUCK.
When we draw a Process Behavior Chart, the calculated Lower and Upper Natural Process Limits make it much more clear that none of the six are an outlier.
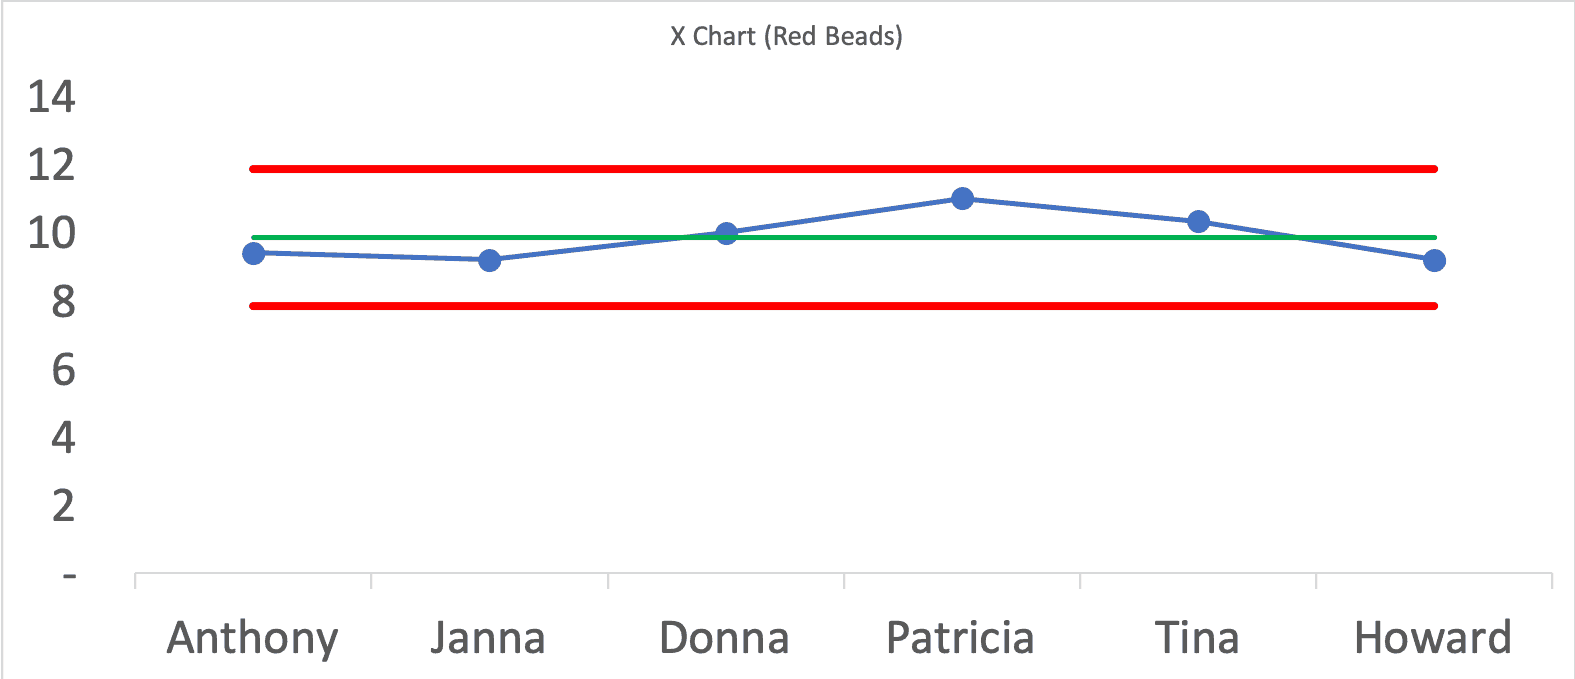
Again, firing the bottom half (or anybody in this system) wouldn't be helpful. It might make a manager or business owner feel like, “Well, at least I'm doing something.” I guess that's a time when Dr. Deming would say, “Don't just do something, stand there.”
Leaders need to work to improve the system instead of blaming individuals for the variable results of a system that they're not allowed to help improve.
Don't fire people based on results that are driven by the design of the system and variation in the system. It's not helpful and there are other reasons it might make you look bad.
One time I facilitated the game. the bottom three performers just happened to be women (I forget how many men we had also playing). The three women got fired. “Performance based.” “Data driven.” But not just.
Somebody commented, in an off-handed and light-hearted way, “Oh, you fired all women… that's going to be a lawsuit!”
In the game last week, you'll notice we had two men and four women playing. All three of the fired workers this time also happened to be women. And, to make the appearance of discrimination worse, I also had to fire the two African-American women who were playing.
They realized I wasn't discriminating. Nobody brought it up. But, wow was I aware of it.
Everybody knows I'm just role playing as I facilitate. But I'd hate to be accused of being sexist or racist.
There is, sadly, too much discrimination that still takes place in the working world. Discrimination is wrong, whether you want to tie that to Toyota's “respect for people” principle or not. Discrimination is bad management. Bad management can sometimes create the appearance of discrimination.
My main point here is to stop firing people based on random targets and thresholds like “the bottom 10%” or “below-average performers.” I'd be curious to look at data that might get people fired from an organization:
- Software bugs in your code
- Software bugs missed in your review or testing
- Post-op complication rates
- # of cash register scans per hour
- Sales figures per salesperson
If we created a Process Behavior Chart, would we see a signifcant difference in people's performance? Maybe. Maybe not. The old Jack Welch / GE rule of “fire the bottom 10% each year,” is completely arbitrary. You could easily have a real workplace system where the performance of the bottom 10% is still within the realm of statistical noise and routine variation.
Is that any way to run a company?
Please scroll down (or click) to post a comment. Connect with me on LinkedIn.
Let’s work together to build a culture of continuous improvement and psychological safety. If you're a leader looking to create lasting change—not just projects—I help organizations:
- Engage people at all levels in sustainable improvement
- Shift from fear of mistakes to learning from them
- Apply Lean thinking in practical, people-centered ways
Interested in coaching or a keynote talk? Let’s start a conversation.


Hi Mark,
I’d like to understand why you chose to create a process behavior chart with the different workers on the X axis. My understanding is that a process behavior chart requires data on the X axis (time) which is continuous in nature, as opposed to categorical which is what the identification of the different workers are.
Would it not make more sense to perform a oneway analysis where the workers are the factor (X axis) and the number of red beads (response) is on the Y axis? Doing that one could assess both the mean for red beads and the variation between workers and determine whether there was any significant difference between the six individuals.
Thanks,
Chuck
Hi Chuck – thanks for your question.
Did you check out this blog post? https://www.leanblog.org/2018/12/using-process-behavior-charts-to-compare-red-bead-game-willing-workers-and-baseball-teams/
You’re right, a Process Behavior Chart is almost always normally a time-series chart. But the idea of doing a snapshot comparison across individuals, teams, or sites is something that Don Wheeler, Ph.D. taught in his 4-day seminar that I took. It’s probably also in his book “Understanding SPC.”
What you described in the 2nd paragraph of your comment sounds like exactly what I did here. There’s no significant difference between the six individuals.
Hi Mark,
Thanks for your response. I agree that one could use a SPC chart to compare the averages between individuals, but I would think that this would require usage of an Xbar-R chart (which is designed to assess data being collected into subgroups) rather than an I-MR chart (where you’re looking at the variation between individual data points). Because you’re subgrouping worker performance and assessing variation between workers based on their average rather than the individual results they got, it seems to me that the Xbar-R chart would be the correct type of control chart to use.
I agree that there’s no statistically significant difference between the six individuals. My point is that the type of data one has collected informs the type of control chart that one should use. In our assessment of data we always first ask, “What type of data is this? Qualitative or Quantitative? Categorical or Continuous?” Answering that guides us towards knowing which of the several control chart options we should be using.
I’ll check out Dr. Wheeler’s SPC book, as he’s recognized as a subject matter expert on this. You’ve got me curious now since using an I-MR chart for categorical data is at variance from much of the training and instruction that I’ve received.
Kind regards,
Chuck
Sure, this is probably a good opportunity for an X-bar and R chart but I think the conclusions drawn would be the same.
But actually, the sample size “n” is not the same for all players in the game… some had 5 samples and some had 3. So I guess the X-bar and R methodology wouldn’t actually work here. It would have if I hadn’t fired anybody…
RE: “My main point here is to stop firing people based on random [arbitrary] targets and thresholds like ‘the bottom 10%’ or ‘below-average performers’.”
Your analysis discounts leaders likely desire to instill fear in employees to achieve multiple practical business needs, which they see as important to the effective working of business. This includes: to assure employees remain task-focused, to remind employees of their low social status, to individualize performance (vs. teamwork), to create competitions to assure that survival and prosperity goes to those who get closest to moral/ethical boundaries (seen as a desirable executive trait), to heighten surveillance and thus intensify micromanagement, to sort company loyalists from the independent thinkers (eliminate culture misfits), to force employees to respect and celebrate (worship) authority (the CEO, especially), to discriminate and homogenize the workforce, neutralize dissent, to impress other people (outsiders), etc.
Of course, all of this is stupid and wrong. Yet those leaders who glorify traditions see merit in doing such things. They do not realize that the traditions which they celebrate expired long ago. Unfortunately, traditions are far more powerful than reason, logic, and evidence. Preconception easily overrides perception.
The LinkedIn discussion:
A good description of some of the lessons from the red bead experiment. Thank you.
“…Process Behavior Chart, would we see a statistically-signifcant difference…”
One note…a control chart is not a test of statistical significance. You are confusing two very different concepts.
True. My slip up. I should say just “significant.“
I agree that companies shouldn’t fire people based on thresholds or targets that don’t reflect a worker’s performance or value to the company. They shouldn’t be held responsible for the failing of a system as a whole. They have no control over what targets and thresholds are set, yet they are held responsible when those aren’t met. A good manager should be looking to make improvements to the system as a whole to ensure that more employees are meeting their goals and performing up to par rather than pushing the blame off to their employees. Targets and thresholds should be used as a guideline to ensure the performance of each employee is improving and if not, changes could be made to make the employee more productive. Firing an employee should be a last ditch effort that includes a lot of thought and consideration of the employees abilities, performance and value to the company rather than firing someone for not meeting one of their targets.
Mark,
I’ve never heard of this red bead game but it seems very interesting. Talking about trying to fire people based on results of a possible false system has raised my interest. This reminds me of a friend of mine who helps manage a gym in the area and unfortunately he’s had lower membership signups then the rest of the managers even at different locations. He’s followed the system and has done everything he could from advertising deals and emailing/calling people interested in the gym. His “failures” and low numbers might not be his fault but it could just be the systems fault which is out of his control. Owners of businesses shouldn’t feel like they need to fire the bottom performers because unfortunately there will always be someone with lower numbers then everyone else. As you said this could be the system and employees shouldn’t feel pressured or the fear of being fired if they are in a lower variance.
Joseph – That seems like a great example. Roughly half of the gym managers are going to have below average numbers. Even if his number is the worst, it doesn’t mean his performance is outside of the normal range of the system.
I have a friend in sales who always used to fluctuate between the top quartile and the bottom half of sales people. He was the same person doing the same work. There’s always variation.
Your friend could regress to the mean in the next time period. If they fire him and the replacement gets that natural variation boost, they will look like a hero… until their performance drops.
Performance Behavior Charts and methods like this help us separate out true outliers from those who are just in the typical band of performance.